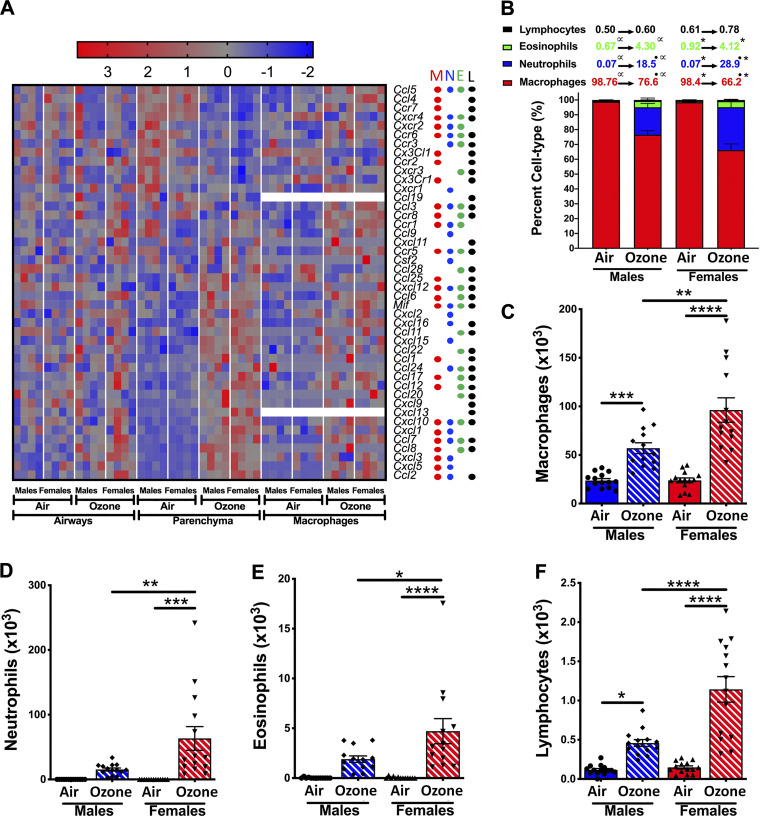
Figure 11.
A: ozone exposure alters gene expression of chemokines and bronchoalveolar lavage fluid immune cell composition. A: heat maps for normalized gene expression values (Z-scores) of chemokine genes in the three compartments. Higher and lower expressions of each gene are represented by red and blue colors, respectively. The relevance of each chemokine in the recruitment of macrophages (M), neutrophils (N), eosinophils (E), and lymphocytes (L) is indicated with red, blue, green, or black dots, respectively. B: percent distributions of immune cells are shown as a stacked bar graph [macrophages (red), neutrophils (blue), eosinophils (green), and lymphocytes (black)]. Values with identical superscript symbols represent a significant difference (P < 0.05). Differential cell counts for macrophages (C), neutrophils (D), eosinophils (E), and lymphocytes (F). Error bars represent means ± SE. *P < 0.05, **P < 0.01, ***P < 0.001, ****P < 0.0001 using ANOVA followed by the Tukey multiple-comparison post hoc test. (n = 13–14 per group).

