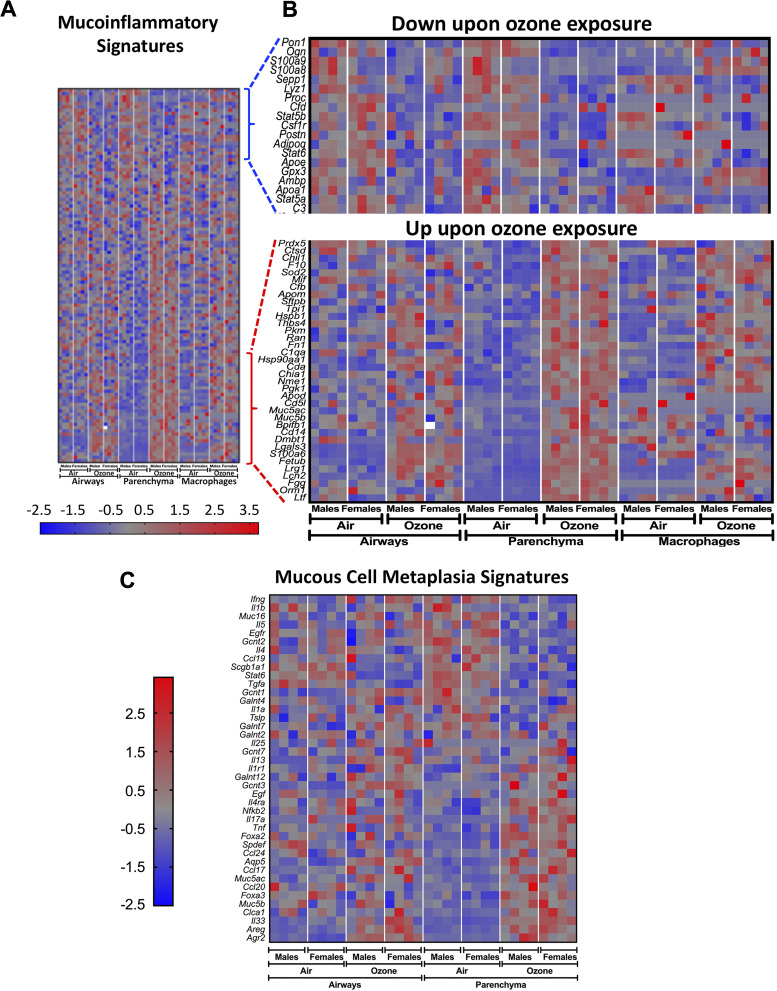
Figure 12.
Gene expression analyses for genes relevant to mucoinflammatory lung diseases and mucous cell metaplasia responses. A: heat maps for normalized gene expression values (Z-scores) of genes associated with mucoinflammatory lung diseases in mice and humans. Low-resolution heat map (left) depicting expression patterns for the entire mucoinflammatory gene set (high-resolution heat map with gene names is presented in Supplemental Fig. S4). Heat map corresponding to gene signatures that were downregulated (B, top) or upregulated (B, bottom) in one or more tissues from ozone-exposed mice was amplified for better resolution. C: heat map for normalized gene expression values (Z-scores) of genes associated with mucous cell metaplasia in mice and humans.

