Figure 3.
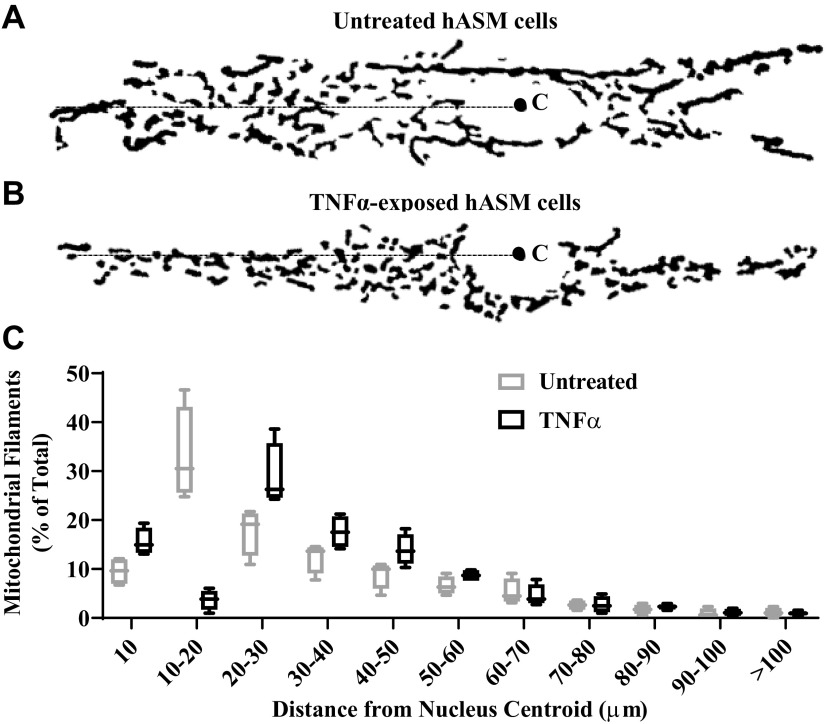
Effect of TNFα on mitochondrial distribution with respect to their distances to nuclear centroids. A and B: representative binary image showing mitochondrial morphology in untreated hASM cells (A) or TNFα-treated human airway smooth muscle (hASM) cells (B) (C: nuclear centroid computed using ImageJ). C: summary data showing the distribution of mitochondrial filaments as %total mitochondria in respect to their distances (in µm) to the nuclear centroid. Treated and untreated groups were collected at the same time and under the same conditions. Data are presented as medians and interquartile range represented as a box-and-whisker plot. Results were analyzed using a paired t test [N = 5 patients (3 males and 2 females), 5 cells per group (TNFα-treated and untreated) for each of hASM samples, n = 25].

