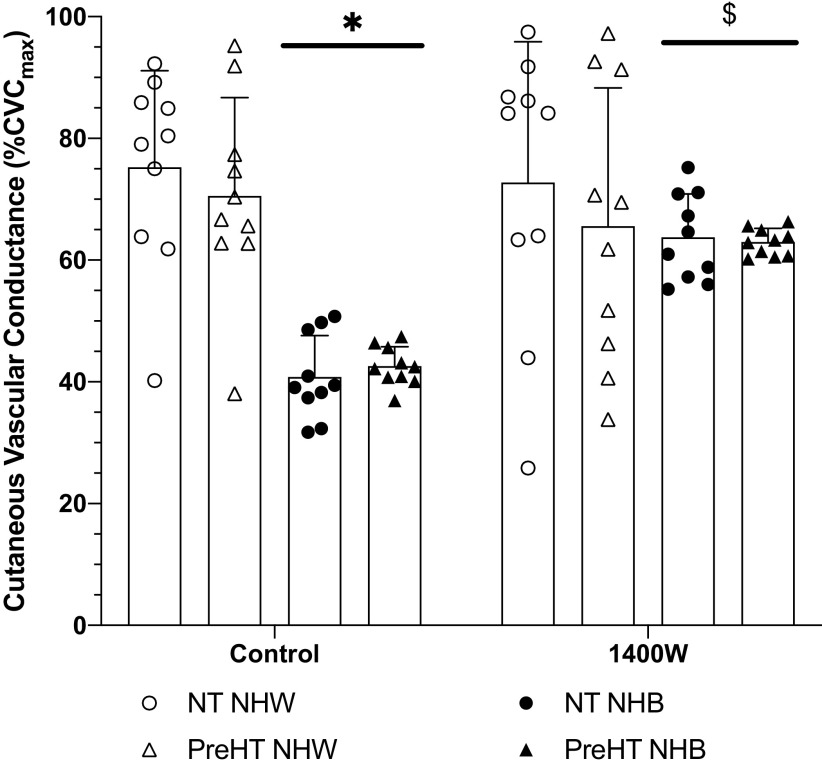
Figure 3.
Plateau % of maximum cutaneous vascular conductance (%CVCmax) responses. Group responses are shown as means ± SD and were compared with a 3-way ANOVA. At control sites, plateau responses were reduced in normotensive (NT NHB, n = 10 participants) and prehypertensive (PreHT NHB, n = 10 participants) non-Hispanic Blacks relative to normotensive (NT NHW, n = 10 participants) and prehypertensive (PreHT NHW, n = 10 participants) non-Hispanic Whites. At 1400W sites, there were no differences between groups. Compared with control sites, 1400W significantly increased the plateau in NT NHB and PreHT NHB. *P < 0.05 vs. NT NHW and PreHT NHW at control sites; $P < 0.05 vs. respective control sites.

