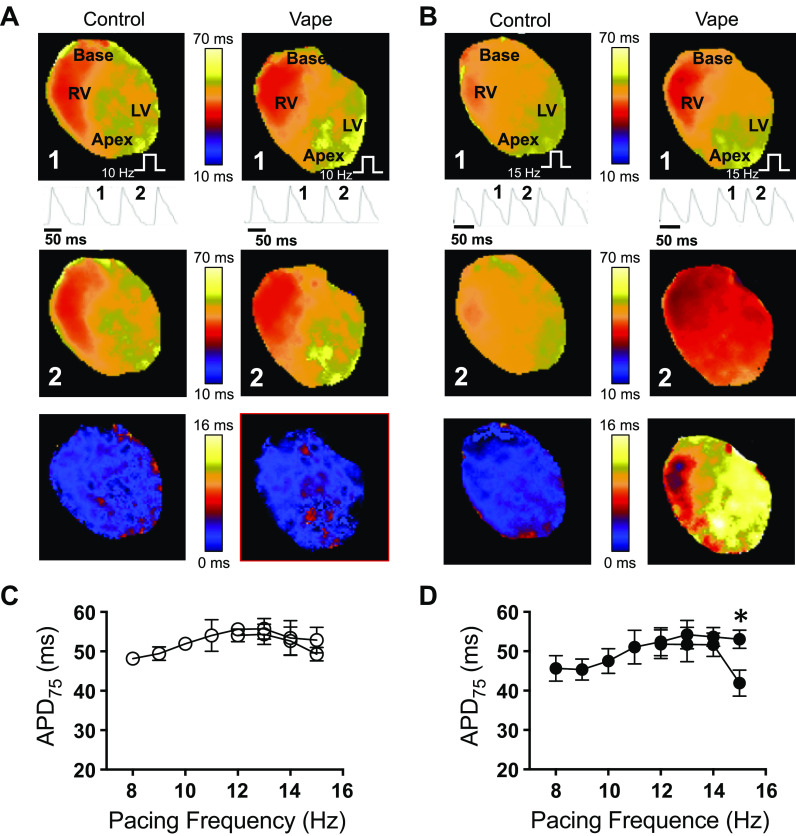
Figure 8.
Optical mapping in isolated Langendorff-perfused mouse hearts. A and B: first (beat 1) and second (beat 2) rows: APD75 maps of two consecutive beats in pacing at 10 (A) and 15 Hz (B). Single-pixel optical action potential traces are shown. Third row: difference maps of APD75 maps of beat 1 minus beat 2. C and D: average APD75 at different pacing frequencies (8 to 15 Hz) in air control (C, n = 4) and VC-exposed (D, n = 3) mice. *P < 0.05, t test. White step symbol: pacing site. LV, left ventricle; RV, right ventricle; VC, vanilla custard.

