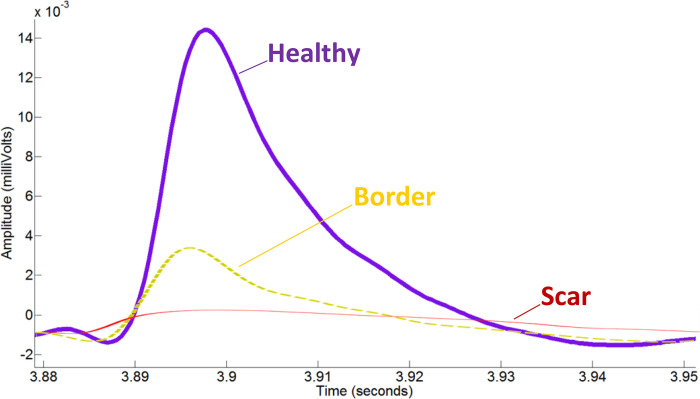
Figure 2.
Epicardial monophasic action potentials are of excellent quality. Three epicardial monophasic action potential tracings from a single 10-wk heart failure (HF) rat. The tracings highlight the substantial difference in monophasic action potential amplitude in millivolts (y-axis) between healthy myocardium, border tissue, and scar tissue, likely due to the decreased number of viable cardiomyocytes. A difference can also be observed in the monophasic action potential duration to 90% repolarization (x-axis). Differences in the waveform slope, particularly in the 2nd and 3rd phase, are thought to be due to impaired potassium efflux associated with ischemic remodeling.

