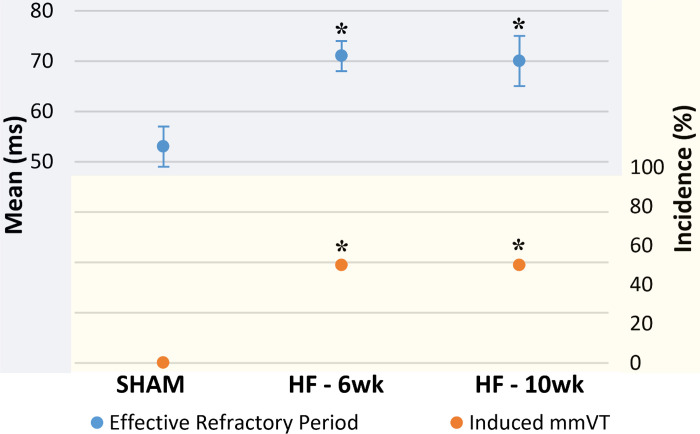
Figure 5.
Plateau of both ventricular tachycardia and effective refractory period. A graph summarizing the electrophysiologic results for incidence of inducible monomorphic ventricular tachycardia (mmVT) and ventricular effective refractory period (ERP; means ±SE. Changes between SHAM (n = 15) and 6-wk heart failure (HF) (n = 20) include an increase in inducible mmVT and a prolongation of the ventricular ERP. These changes do not continue between 6 wk and 10 wk of HF (n = 10). *P < 0.01 vs. SHAM (ERP: ANOVA-Tukey; mmVT: Fisher’s exact).

