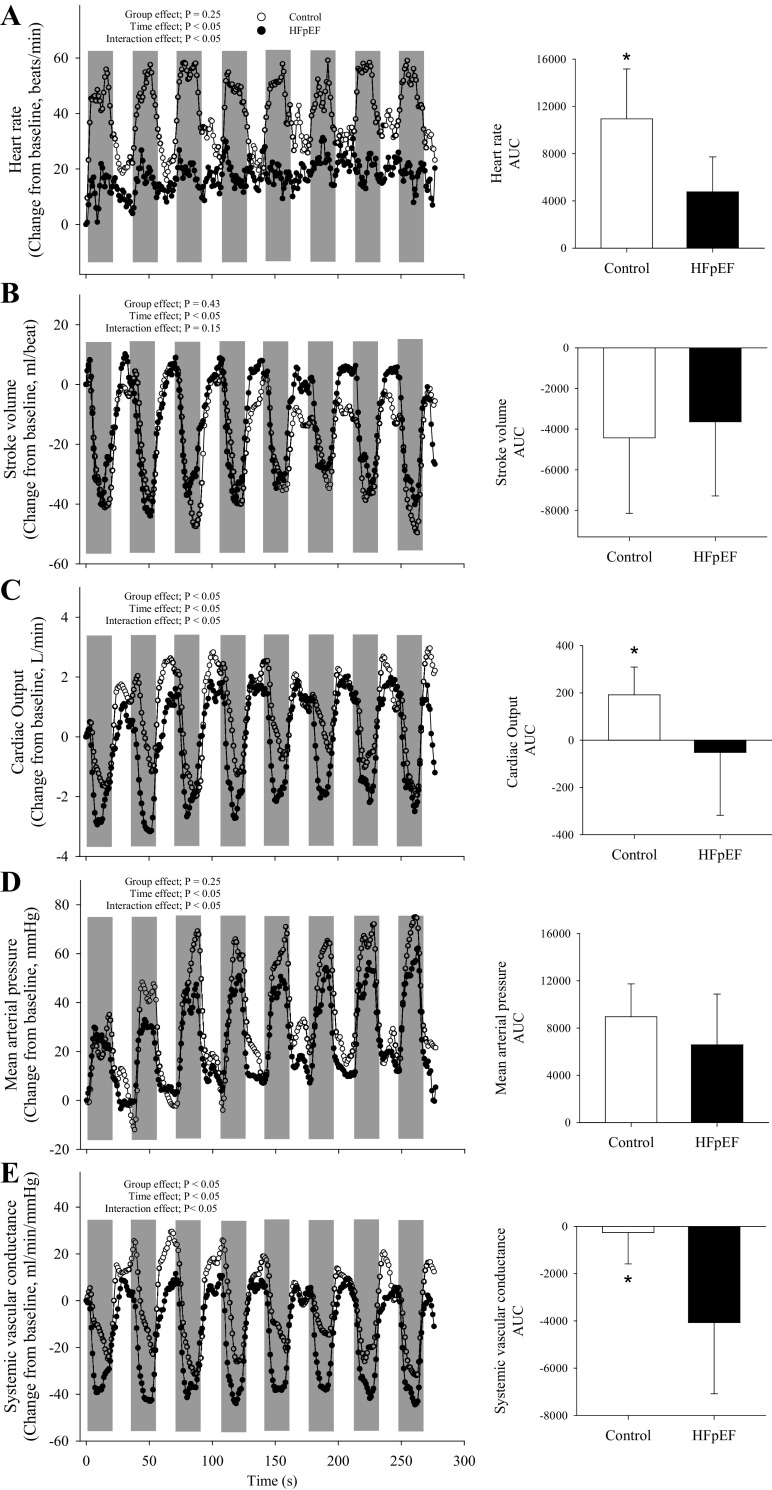
Figure 5.
Second-by-second plots of heart rate (A), stroke volume (B), cardiac output (C), mean arterial pressure (D), and systemic vascular conductance (E) for controls (open bars; n = 8) and patients with heart failure with preserved ejection fraction (HFpEF; filled bars; n = 8). Shaded regions represent the maximal 15-s isometric contraction. Main effects were determined via 2-way mixed-model ANOVAs (group × time); independent group t tests were used to determined group differences for the area under the curve for each variable (A–E; presented in bar graph at the right). Data are presented as means ± SD, except that the SD was omitted in the across-time figures for clarity. *Significant difference between groups, P < 0.05.

