Figure 3.
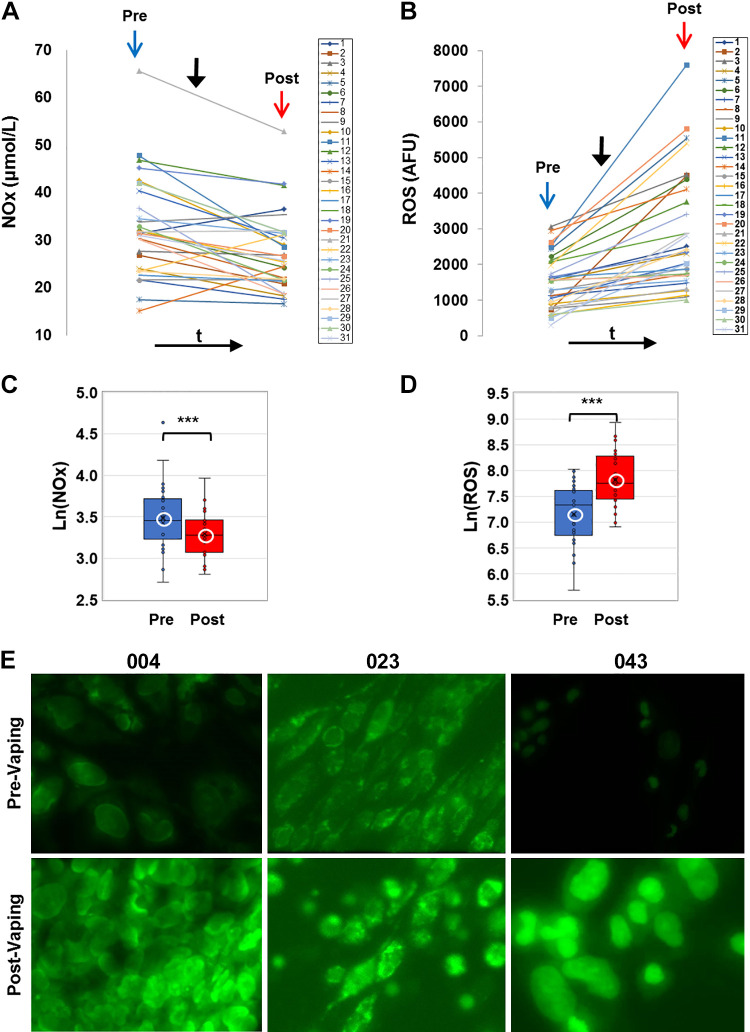
Nitrate-nitrite (NOx) in serum and reactive oxygen species (ROS) production. A and B: profiles of NOx and ROS for all subjects before (pre, blue arrow) and after (post, red arrow) e-cig vaping. Solid black arrow denotes point in time of e-cigarette (e-cig) aerosol inhalation. Serum samples were assayed for NOx colorimetrically using a nitrite-nitrate Griess reaction assay and NOx was quantified by standard curves. ROS production was quantified via fluorescence intensity measurements (see materials and methods). B, inset: box and whiskers plots of ROS, plotted in log scale (***P < 0.0005). C and D: box and whiskers plots of NOx pre- and postvaping, plotted in log scale. Group average and median are indicated by white circle and horizontal bar, respectively; ***P < 0.0005. E: human pulmonary microvascular endothelial cells exposed to media with 10% serum extracted pre- and post-e-cig vaping. Results from 3 sample subjects (004, 023, and 043) are shown. The cells were labeled with CellROX Green fluorescent dye, sensitive to ROS production. Cells were imaged on the stage of a microscope at λex 488 nm, λem 500-560, max ∼530 nm. All images were acquired at the same settings on Nikon Axiophot microscope using Metamorph Imaging Software. AFU, arbitrary fluorescence units.

