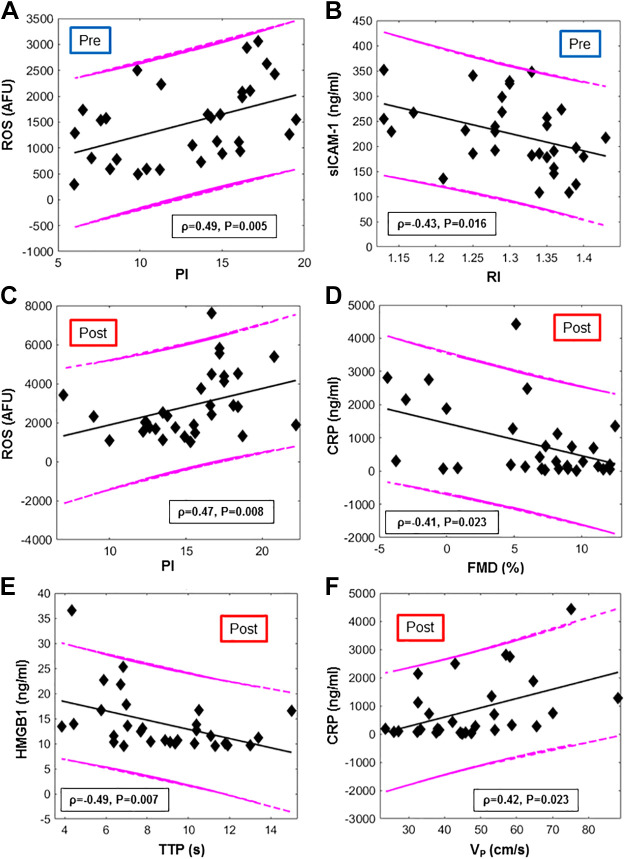
Figure 5.
Correlation between blood-based markers and MRI metrics (colored online). Scatterplots of biomarkers plotted vs MRI metrics, evaluated before (pre) and after (post) e-cig vaping. A and C: reactive oxygen species (ROS) vs Pulsatility Index (PI) respectively, before and after e-cig vaping. B: intercellular adhesion molecules (sICAM) vs resistivity index (RI). D: C-reactive protein (CRP) vs luminal flow-mediated dilation (FMD). E: high mobility group box 1 (HMGB1) vs. time to peak velocity during hyperemia (TTP). F: CRP vs. peak hyperemic velocity (VP). The Spearman’s correlation coefficients and respective P value are provided, along with 95% prediction intervals and regression lines.

