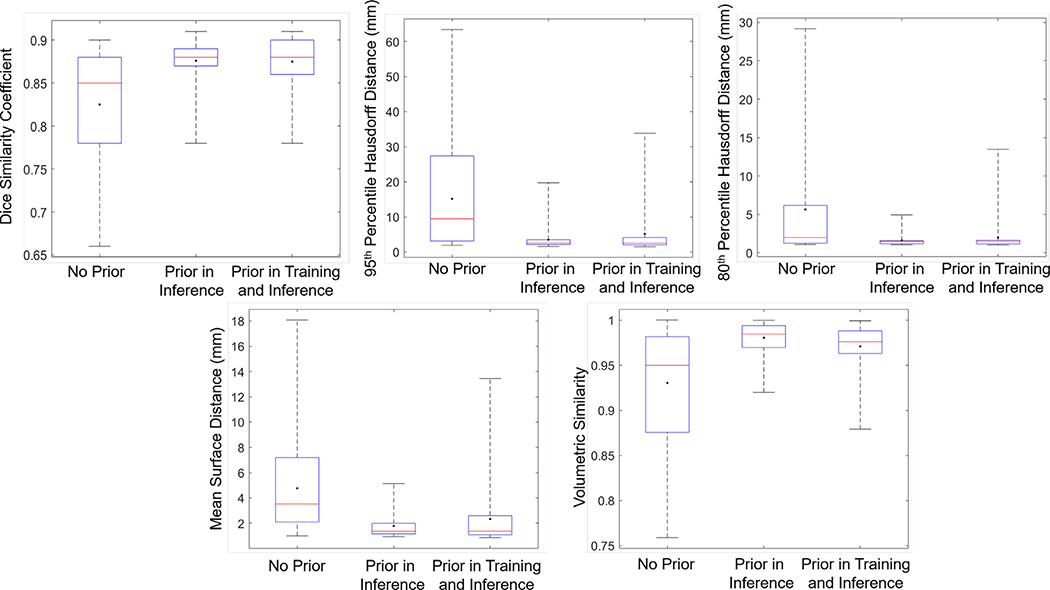
Fig. 8.
Box plots of testing results. DSC (top left), HD95 (top middle), HD80 (top right), MSD (bottom left), and VS (bottom right) for each scenario in the proposed method. Red horizontal line in each box is median value and dot indicates mean value. The box shows interquartile range. (For interpretation of the references to color in this figure legend, the reader is referred to the web version of this article.)

