Fig. 2.
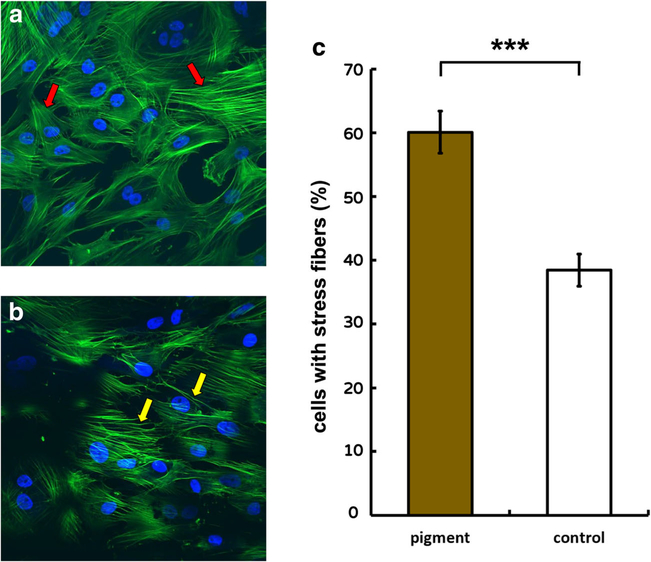
F-actin stress fibers formation. In the control group, trabecular meshwork (TM) cells exhibited smooth and thin F-actin filaments (a, red arrows). After 24 h, TM cells exhibited F-actin with thick, long, and curved stress fibers (b, yellow arrows). The pigment dispersion group (60.1 ± 3.3%, n = 10) contained a significantly larger number of cells with stress fibers, compared to the control group (38.4 ± 2.5%, n = 11, ***p <0.001; c)

