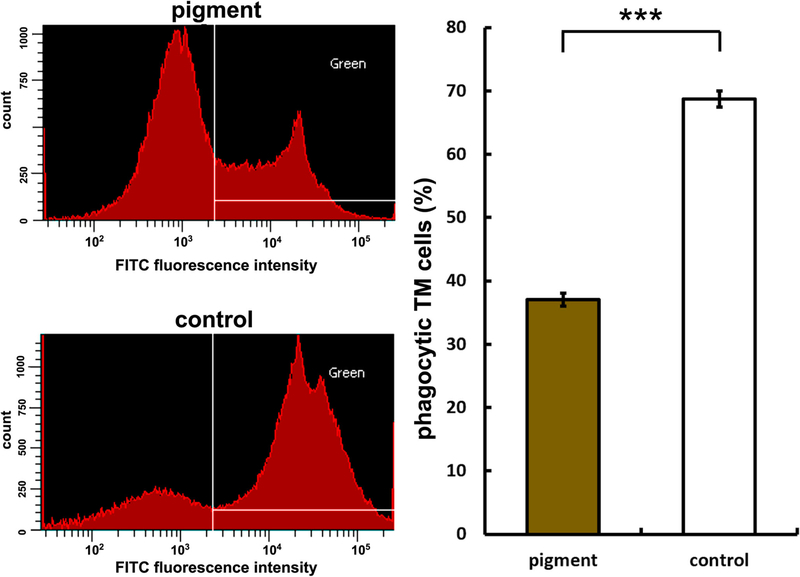
Fig. 3.
Reduced phagocytosis. Left panels show histograms of cells measured via flow cytometry. White lines demarcate boundaries within which cells are positively labeled for green fluorescence. Cells that contained green microspheres in the pigment dispersion group (top left panel) are compared to control (bottom left panel).Uptake of yellowgreen fluorescent microspheres in the pigment dispersion group was significantly lower (37.0 ± 1.1%) than uptake in the control group (68.7 ± 1.3%, n =3,***p <0.001)

