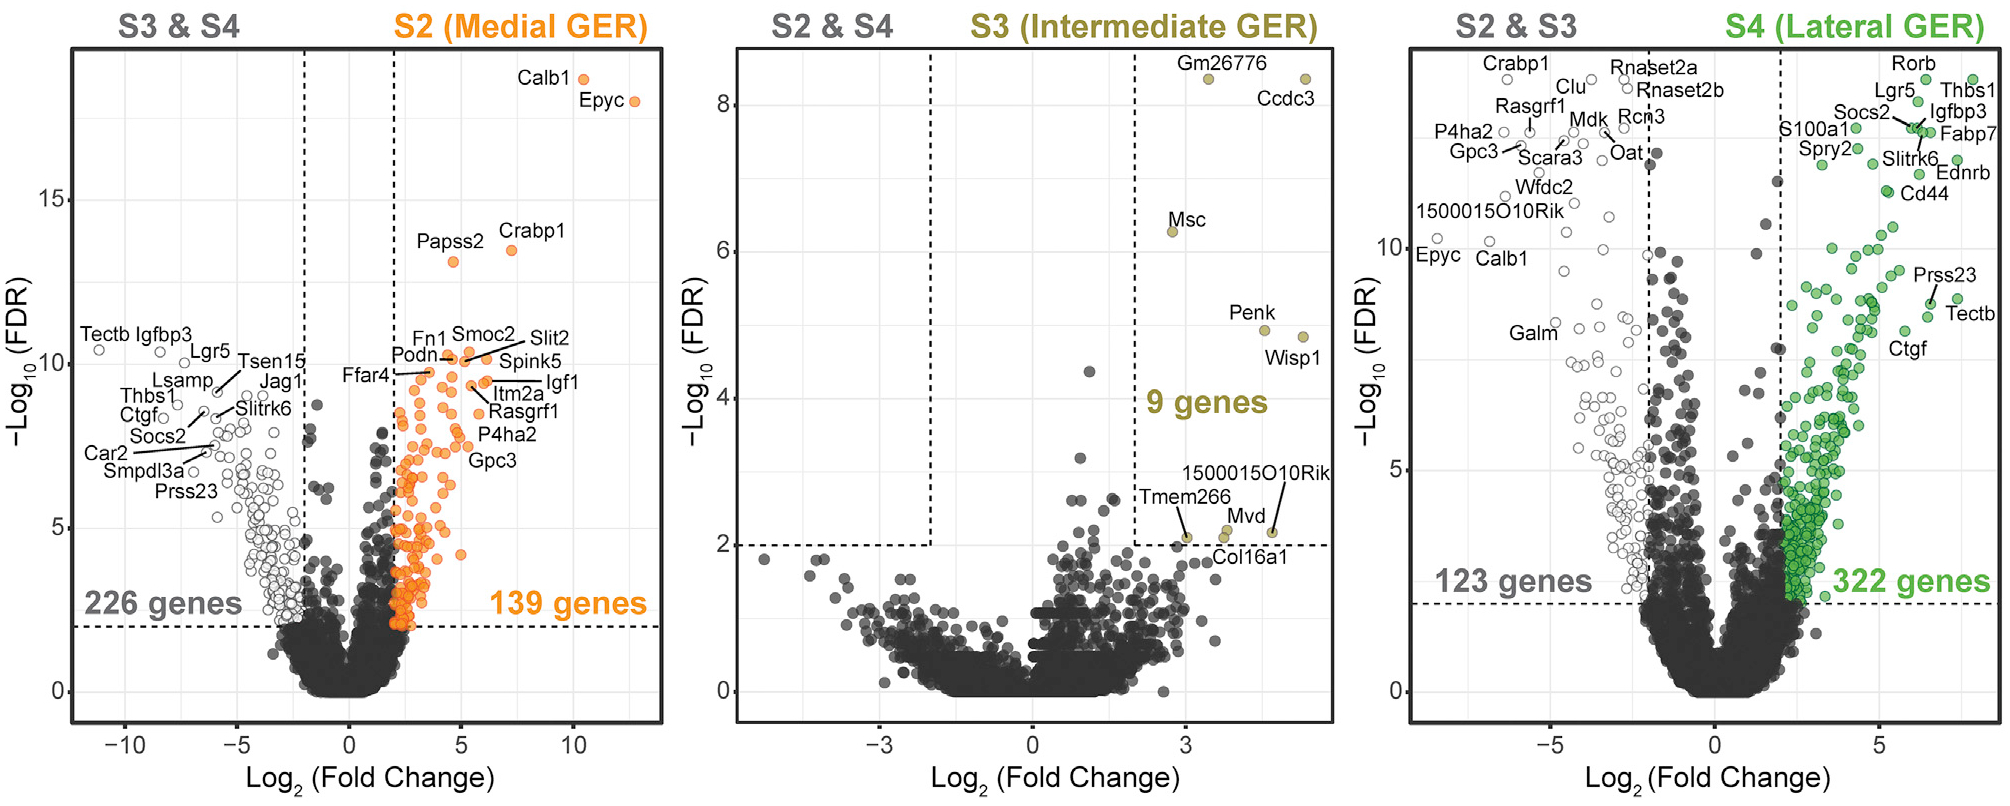
Figure 5. Differential gene expression among the three GER clusters.

Volcano plots showing comparisons between each GER cell cluster (S2, S3, and S4) with the remaining GER cells. Thresholds are indicated with dotted lines: log2-fold expression difference of >2 or <−2 and −log10(FDR) > 2 (FDR < 1%). Labeled are top differentially expressed genes in medial (S2: left), intermediate (S3: middle), and lateral (S4: right) GER cells. The full list of differentially expressed genes is shown in Table S4. Wilcoxon rank-sum test was used for all comparisons shown here.
