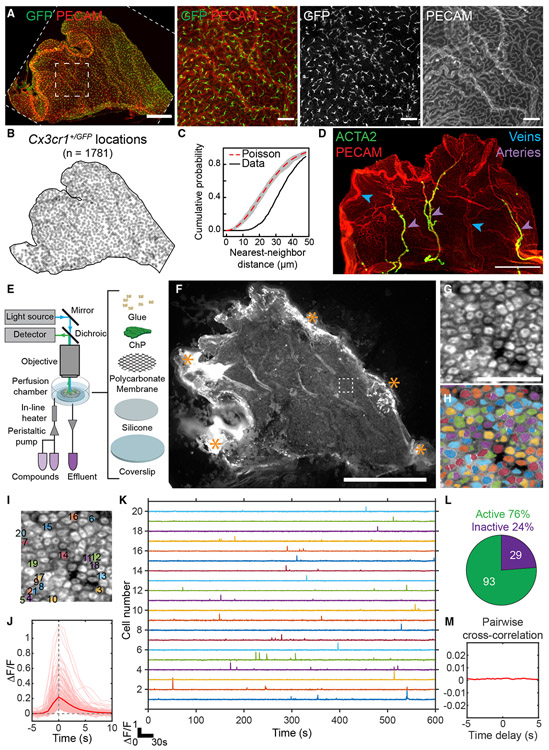
Figure 1. Isolation, Immunostaining, and Calcium Imaging of Lateral Ventricle ChP Explants.
(A) Left: large leaf of LV ChP from a Cx3cr1+/GFP mouse immunostained with anti-GFP (green, immune cells) and PECAM (red, vasculature). Scale bar, 500 μm. Right: zoom-in of small dashed box. Scale bar, 100 μm. Cx3cr1+/GFP cells tile the ChP (confirmed in eight other mice).
(B) Positions of 1,781 Cx3cr1+/GFP cells from (A).
(C) Cumulative distribution of nearest-neighbor distances of each Cx3cr1+/GFP cell. Immune cells showed regular spacing (~30 μm) relative to random Poisson spacing (red trace; gray envelope, 1% acceptance interval).
(D) PECAM (red) and ACTA2 (green) immunostains demarcate stereotyped LV ChP regions (confirmed in three other mice). Purple arrowheads, arteries. Blue arrowheads, veins. Scale bar, 500 μm.
(E) Light path and setup for imaging LV ChP.
(F) Epifluorescence image containing a FoxJ1-Cre::Ai95D LV ChP explant expressing GCaMP6f in multiciliated ChP epithelial cells. Cells near stabilizing glue attachments at explant borders (asterisks) showed elevated GCaMP6f fluorescence (indicating unhealthy cells) and were excluded from subsequent analyses. Scale bar, 1 mm.
(G) Zoom-in of 122 epithelial cells (dashed box in F). Scale bar, 50 μm.
(H) Cell masks (see STAR Methods).
(I) Twenty labeled cells corresponding to traces in (K).
(J) Pink, traces surrounding each calcium transient with a fractional change in fluorescence, ΔF/F > 5σ (235 events across 122 cells from H). Red, mean calcium transient across traces.
(K) Five-minute time courses from cells in (I).
(L) Seventy-six percent of cells (93 of 122) in (H) exhibited calcium events.
(M) Average of all cross-correlations between binarized event time courses of all pairs of cells from (H) (computed at delays from −5 to +5 s), demonstrating that spontaneous events were uncorrelated across cells. We observed qualitatively similar results as in (G)–(M) in 25 other mice (not shown).

