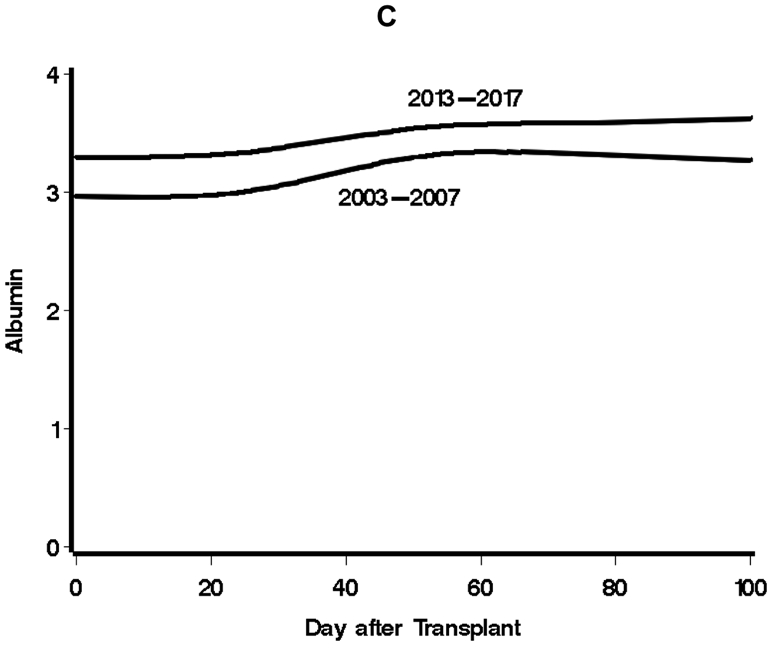
Figure 2.


Comparison of daily laboratory values in conventional units for total serum bilirubin (A), serum creatinine (B), and serum albumin (C), 2003-2007 vs. 2013-2017. Restricted cubic spline curves are fit to the observed data (see Appendix, Supplementary Statistical Methods). Factors for conversion to SI units are 17.1 for total serum bilirubin, 88.4 for serum creatinine, and 10 for serum albumin.
