Fig. 1.
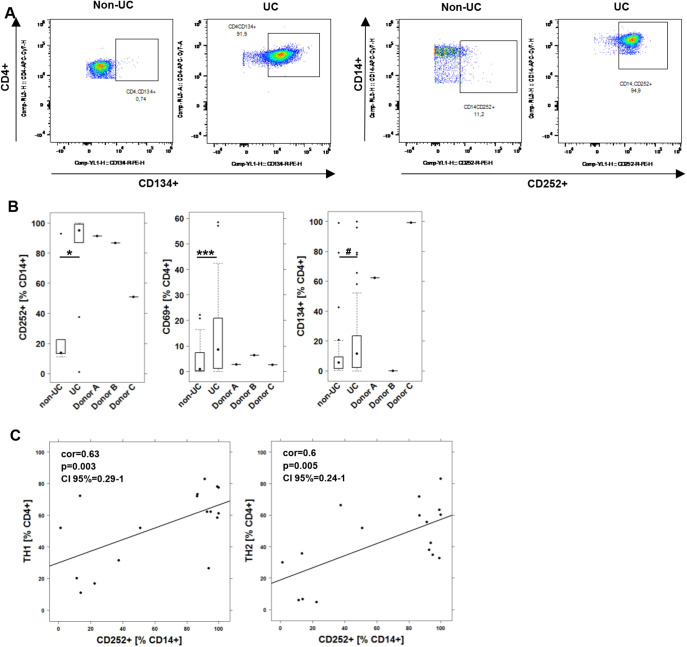
Immune profiling of non-UC donors and UC patients. (A) Representative flow cytometric images of CD4+ CD134+ and CD14+ CD252+ (OX40L) cells in PBMCs from non-UC and UC donors. (B) Frequencies of activated CD4+ T cells (CD134+ and CD69+) and CD252-expressing CD14+ monocytes depicted as boxplots. Boxes represent upper and lower quartiles; whiskers represent variability, and outliers are plotted as individual points. For comparison of groups, Student's unpaired t-test was conducted. Donor A-C refers to donors of PBMCs used in the animal study. ***P<0.001, *P<0.05, #P<0.1. (C) Correlation analysis of OX40L (CD252) with TH1 and TH2 CD4+ T cells. The numbers display Pearson's product-moment correlation values (cor), P-values (P) and the 95% confidence interval (CI).

