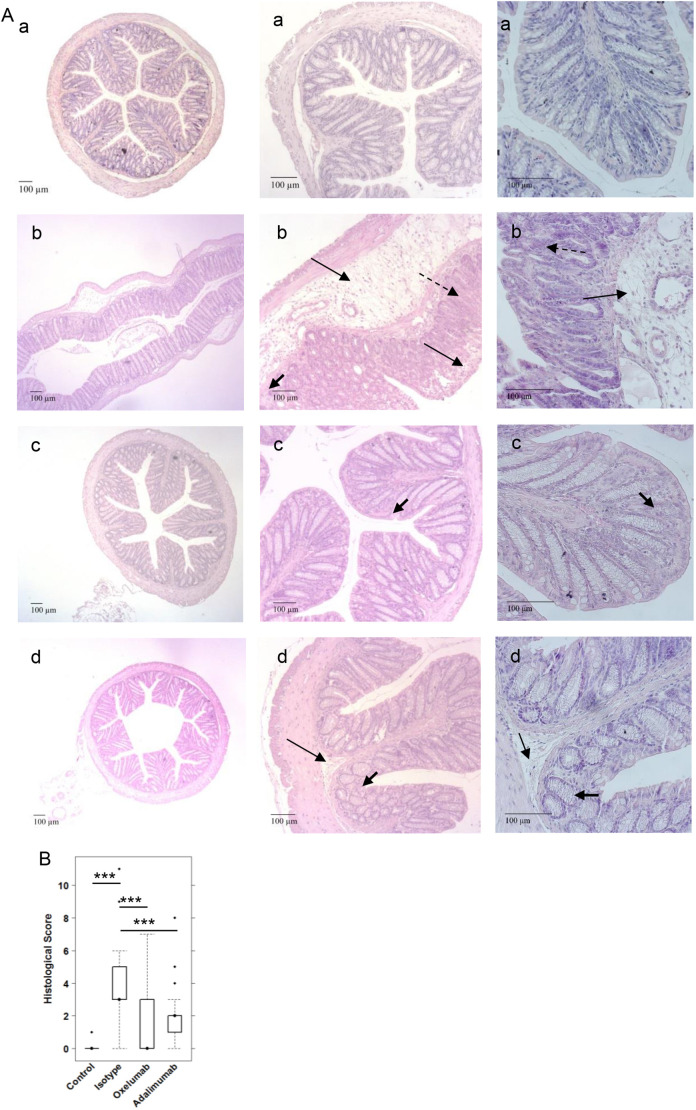
Fig. 3.
Comparison of the efficacy of oxelumab and adalimumab in vivo. Mice were treated as described in Fig. 2. (A) Representative photomicrographs of H&E-stained sections of distal parts of the colon from mice: (Aa) unchallenged control; (Ab) ethanol challenged control treated with isotype; (Ac) ethanol challenged group treated with oxelumab; and (Ad) ethanol challenged group treated with adalimumab. Arrows indicate edema and influx of inflammatory cells; dashed line arrows indicate destruction of crypts; bold arrows indicate fibrosis. (B) Histological scores depicted as boxplots. Boxes represent upper and lower quartiles; whiskers represent variability, and outliers are plotted as individual points. For comparison of groups, ANOVA followed by Tukey's HSD was conducted (***P<0.001).

