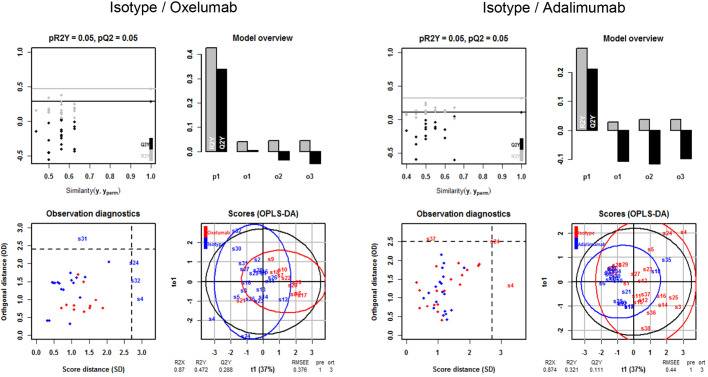
Fig. 5.
Comparison of the efficacy of oxelumab and adalimumab in vivo by orthogonal partial least squares discrimination analysis. NSG-UC mice were treated as described in Fig. 2. Variables used were clinical, colon and histological scores and serum concentrations of IL-6, IL-1β and glutamic acid. Q2Y, fraction of variation of the y variables predicted by the model; R2X, fraction of the variation of the X variables explained by the model; R2Y, fraction of the variation of the Y variables explained by the model; RMSEE, root mean square error of estimation.

