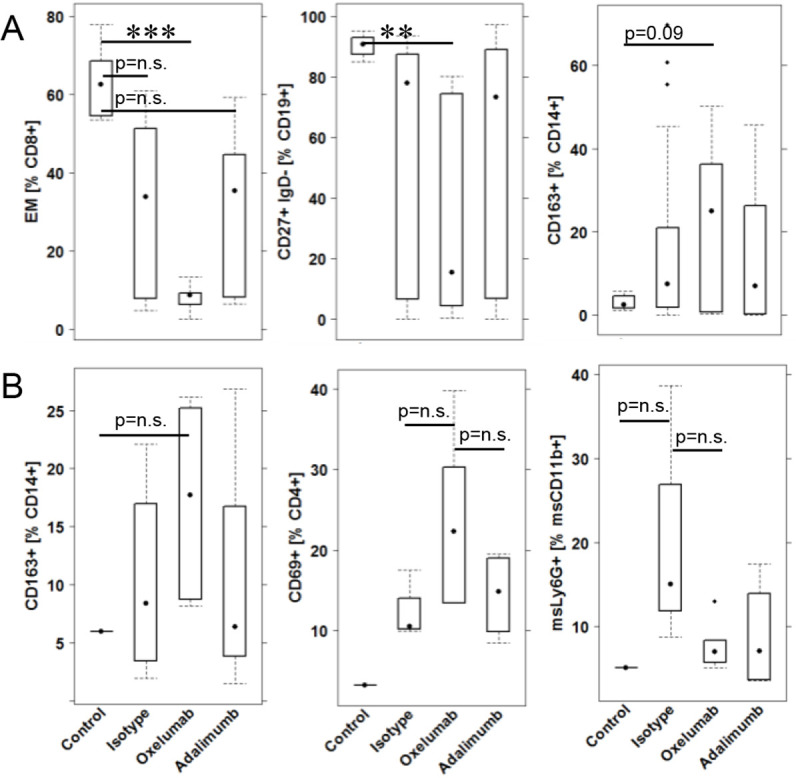
Fig. 6.

Impact of treatment with oxelumab and adalimumab on leukocytes. (A) Splenic leukocytes. (B) Colonic leukocytes. Mice were treated as described in Fig. 2. Boxes represent upper and lower quartiles; whiskers represent variability, and outliers are plotted as individual points. For comparison of groups, ANOVA followed by Tukey's HSD was conducted. Labels given on the x-axes on the bottom row apply to all charts. For comparison of groups, ANOVA followed by Tukey's HSD was conducted (***P<0.001, **P<0.01; n.s., not significant).
