Fig. 2.
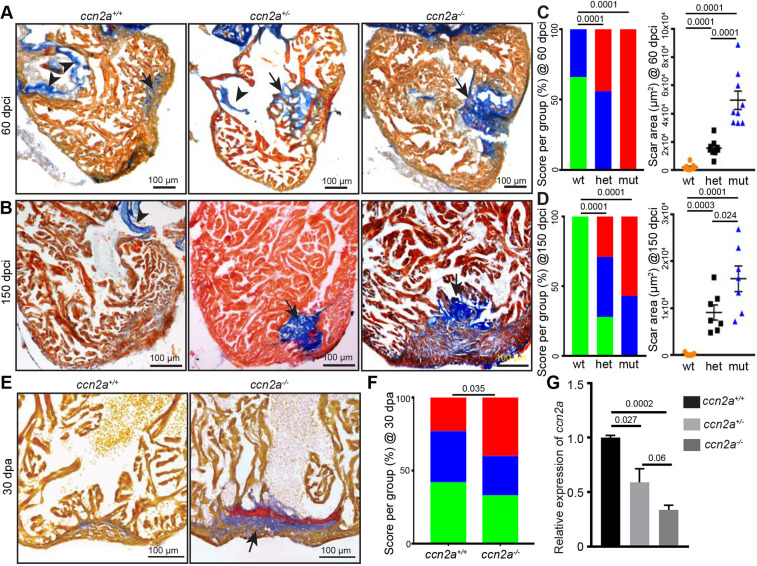
ccn2a mutant hearts exhibit increased scarring after injury. (A,B) Representative bright-field images of 12 μm sagittal paraffin sections of 60 dpci (A) and 150 dpci (B) hearts stained with acid fuchsin-orange G (AFOG; muscle, yellowish red; fibrin, brick red; collagen, blue). Arrows and arrowheads indicate the collagenous scar and atrioventricular valves, respectively. (C,D) Semi-quantitative analysis of scarring in ccn2a+/+, ccn2a+/− and ccn2a−/− hearts (n=9 each) at 60 dpci (C), and ccn2a+/+, ccn2a+/− and ccn2a−/− hearts (n=7 each) at 150 dpci (D). Color-coded bar chart indicates the degree of regeneration: green, complete; blue, moderate; red, very poor. Data indicate the percentage of total hearts represented by each score. The statistical significance of differences was evaluated by a wound-recovery χ2 test. Dot plots show highest area covered by collagenous scar on a tissue section from each heart. Data are mean±s.e.m. (E) Sagittal sections of 30 dpa ventricles stained with AFOG. Example of a vigorously regenerating ccn2a+/+ heart and a poorly regenerating ccn2a−/− heart section. Arrow indicates the collagenous scar. (F) Semi-quantitative analysis of wound recovery in 25 ccn2a+/+ and 30 ccn2a−/− animals. Average of area covered by collagen on three histological sections in each heart was considered for scar quantification. Color-coded bar chart indicates degree of regeneration: green, complete; blue, moderate; red, very poor. Data indicate the percentage of total hearts represented by each score. The statistical significance of differences was evaluated by a wound-recovery χ2 test. (G) qPCR analysis of ccn2a transcripts in 48 hpf embryos from three genotypes. Values are normalized to the mean of the wild type. Data are mean±s.d. dpci, days post cryoinjury; dpa, days post amputation; hpf, hours post fertilization.

