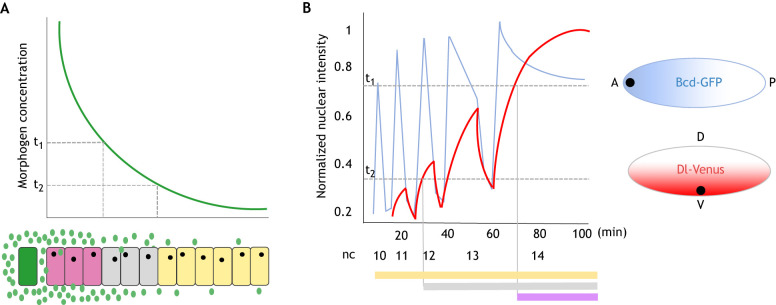
Fig. 1.
Comparison of Bicoid and Dorsal morphogens in space and over time in Drosophila embryos. (A) The French flag model for patterning (Wolpert, 1969) includes morphogen production from a source (green) along with its diffusion to neighboring cells, generating a morphogen gradient. A cell exposed to morphogen concentration above threshold 1 (t1) adopts one cell fate (pink), whereas cells at a distance adopt distinct cell fates (gray versus yellow) in response to lower morphogen concentrations above or below threshold 2 (t2). (B) A conceptual representation of the AP patterning morphogen Bicoid (Bcd; blue) and the DV patterning morphogen Dorsal (Dl; red) from nuclear cycle (nc) 10 to 14. Fluorescence intensity was measured by monitoring Bcd-GFP or Dl-Venus. For Bcd-GFP, the measurements were taken at a single nucleus located 10% of the way along the AP axis. For Dl-Venus, the measurements were taken at the ventral-most region. The intensities were normalized to the maximum value (Gregor et al., 2007; Reeves et al., 2012). Scheme representing gradients of Bcd along the AP axis (blue) and Dl along the DV axis (red) in Drosophila blastoderm embryos, and a hypothetical target gene threshold responses graph. A, anterior pole; P, posterior pole; D, dorsal region; V, ventral region.

