. 2021 Jan 14;10:e55081. doi: 10.7554/eLife.55081

Figure 3. Partner preference test.

(A) Representative figure showing the design of the arena in which voles were tested for partner preference test. (B) Between 48 and 72 hr of cohabitation, partner preference was evaluated on each subject (N = 32). Partner preference index revealed a significant difference between the time spent on the incentive area related to the partner, with the incentive area related to the stranger vole. Boxplot graphs show whiskers with 10–90 percentiles; horizontal line inside the box shows data median, and ‘+’ represents data mean. (*) denotes significance at p<0.05.

Figure 3—source data 1. Values of parter preference index obtained from the proportion of time spent on social incentive areas related to the partner and stranger voles.

Figure 3.

Figure 3—figure supplement 1. Partner preference indexes at two different time points.
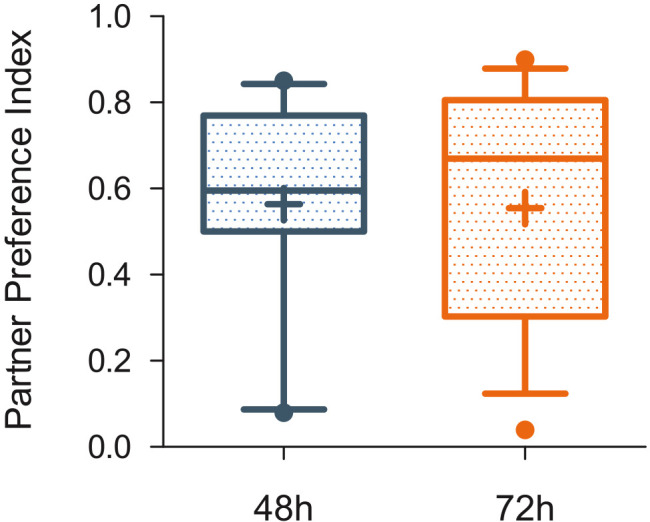
Figure 3—figure supplement 1.

No significant differences were found between Partner preference indexes obtained 48 hr after the onset of cohabitation (N = 16) in male (n = 7) and female (n = 9) prairie voles, with Partner preference Indexes obtained 72 hr after the onset of cohabitation in male (n = 9) and female (n = 7) voles.
Figure 3—figure supplement 1—source data 1. Partner preference index comparison at different PPT test times (48 vs 72 hr) from the onset of cohabitation.