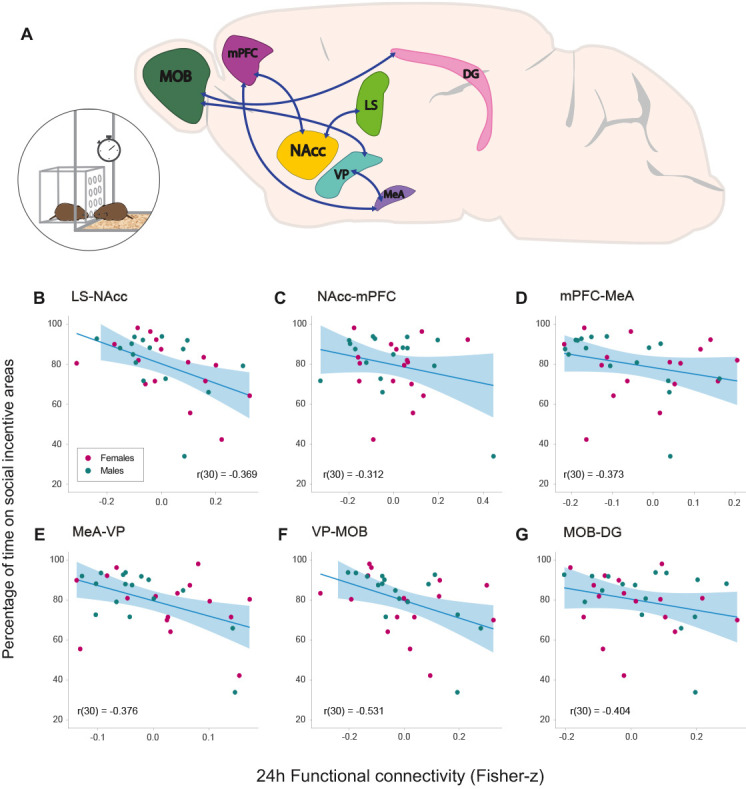
Figure 4. Relationships between functional connectivity 24 hr after the onset of cohabitation and social interaction during partner preference test in male and female prairie voles.
(A) Representation of a prairie vole brain with regions (nodes) that constitute the network with a significant negative association with the amount of social interaction during the PPT. Scatter-plot graphs (B–G) of the connections in a with best line fit between baseline functional connectivity (Fisher z-transformed partial-correlation values) and time on social incentive areas during cohabitation (percentage). The lower the connectivity between these regions at 24 hr of cohabitation, the longer the time spent on social incentive areas during the PPT. DG: dentate gyrus. LS: lateral septum. MeA: medial amygdala. MOB: main olfactory bulb. mPFC: medial prefrontal cortex. NAcc: nucleus accumbens. VP: ventral pallidum.

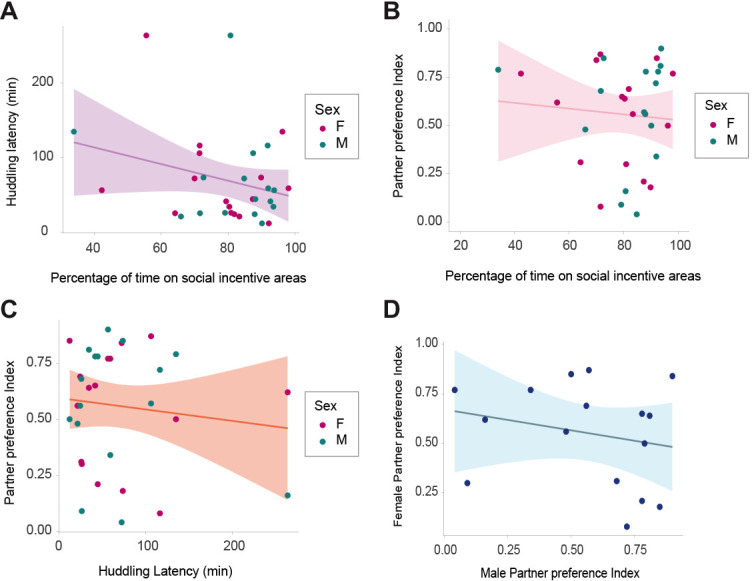
Figure 4—figure supplement 1. Relationships between social behaviors in the prairie vole.

