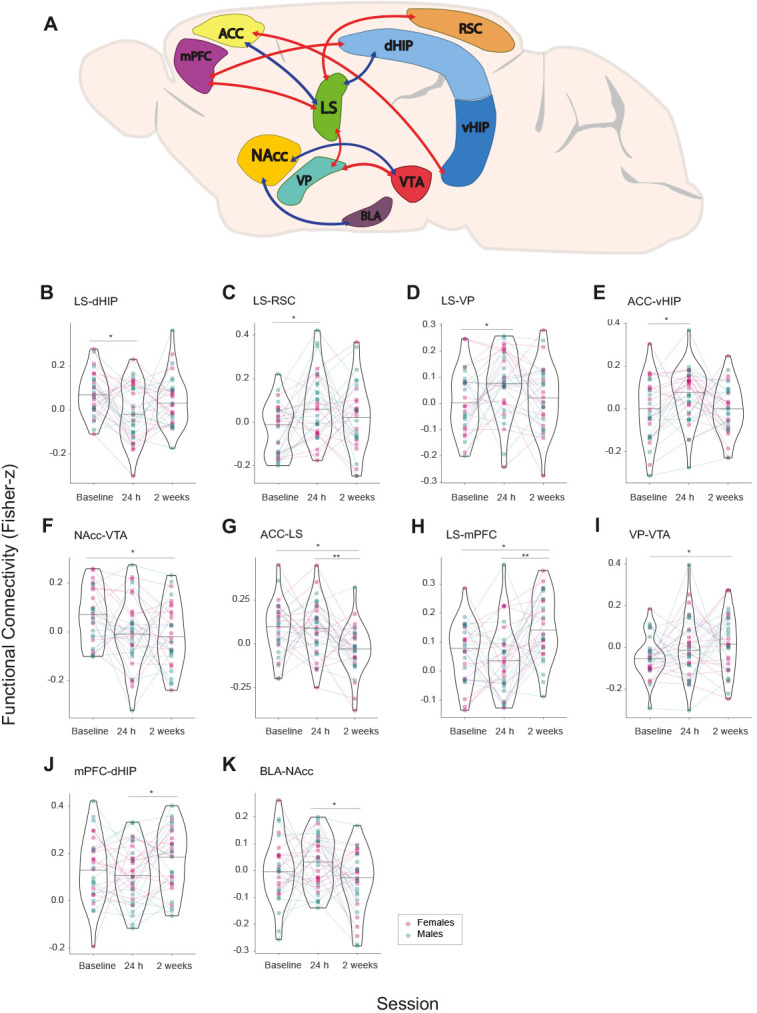
Figure 5. Network-wide changes in time in brain functional connectivity of female and male prairie voles.
(A) NBR analysis via Linear mixed models (LMM) analysis results represented in a prairie vole brain with regions (nodes) comprising the brain network that undergoes significant changes in functional connectivity (Fisher z-transformed correlation values) after cohabitation with mating. Interregional connectivity (edges) is shown by color code. Red: increase of functional connectivity; blue: decrease of functional connectivity. ACC: anterior cingulate cortex. BLA: basolateral amygdala. dHIP: dorsal hippocampus. LS: lateral septum. mPFC: medial prefrontal cortex. NAcc: nucleus accumbens. RSC: retrosplenial cortex. vHIP: ventral hippocampus. VP: ventral pallidum. VTA: ventral tegmental area. (B–K) Functional connectivity values in violin plots showing full distribution of data and median. Connecting lines track longitudinal data of each subject between regions through specific MR acquisition time points (Session): Baseline, 24 hr, and 2 weeks of cohabitation. Color codes for data points and connecting lines distinguish male (cyan) from female subjects (pink). False discovery rate (FDR) post hoc significant differences are shown: *<0.05, **<0.01, ***<0.001.

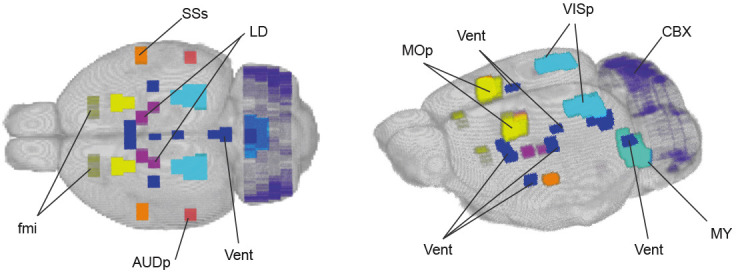
Figure 5—figure supplement 1. Control regions for the longitudinal analysis of rsfMRI data.

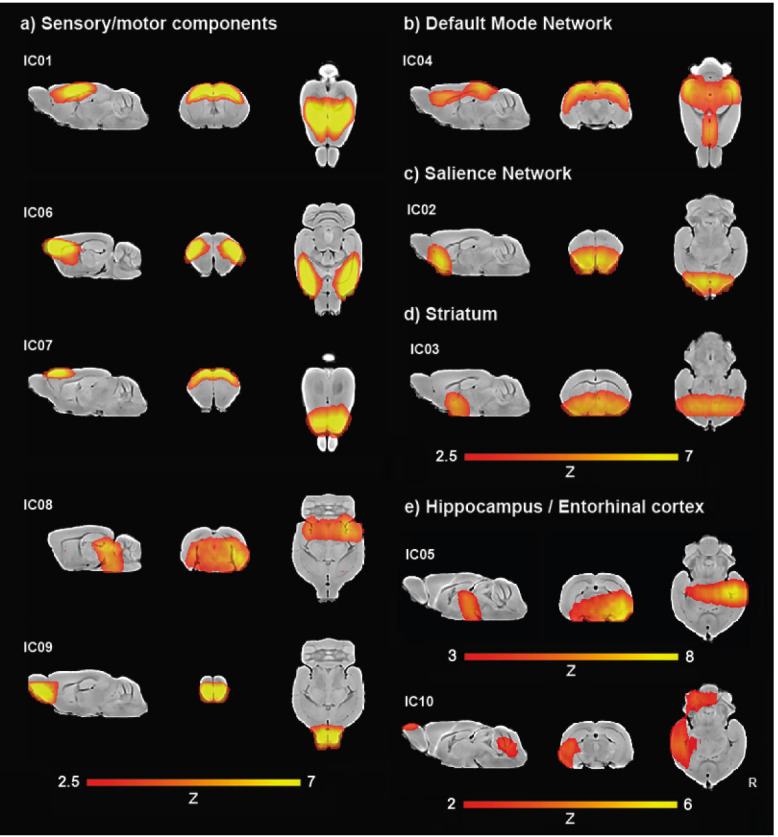
Figure 5—figure supplement 2. Ten components gICA.

