. 2021 Jan 20;10:e61980. doi: 10.7554/eLife.61980

Figure 1. Sample processing and chromatography parameters.

(A) The number of metabolites identified with high confidence spectral database matching in whole bone marrow (WBM) samples after HILIC or reverse phase chromatography (n = 3 replicates per group from one experiment). (B) Average peak intensities in sheath fluid background samples after drying with a standard vacuum concentrator, a vacuum concentrator in a positive pressure HEPA-filtered clean hood, or with no drying (n = 5 replicates per treatment from one experiment). (C) Number of metabolites significantly above sheath fluid background in 10,000 sorted WBM cells after drying with a standard vacuum concentrator, a vacuum concentrator in a clean hood, or with no drying (n = 5 replicates per treatment from one experiment). The threshold for statistical significance relative to background or other samples was always set at fold change >2 and false discovery rate (FDR) < 0.05, unless otherwise indicated. (D) Metabolites detected in 100,000 WBM cells extracted with 80% acetonitrile in water (ACN), 80% methanol in water (MeOH), or 40% ACN plus 40% MeOH in water (Mix) (n = 3 replicates per treatment from one experiment). (E) Overlap in metabolites detected with each extraction solvent (n = 3 replicates per treatment from one experiment). (F) Number of metabolites significantly above background in 10,000 WBM cells sorted using a 70 or 100 μm nozzle, and 0.5× or 1.0× phosphate buffered saline (PBS) sheath fluid (n = 5 replicates per treatment in each of three independent experiments; the metabolites that significantly differed between 0.5× PBS versus 1× PBS sheath fluid are listed in Figure 1—source data 2, Supplementary Table 1). (G) Number of metabolites significantly above background in 10,000 sorted WBM cells or 10,000–100,000 pipetted WBM cells (n = 5 replicates per treatment in each of three independent experiments). (H–K): (H) Principal component analysis of 10,000 sorted or pipetted HNT-34 AML (AML) cells or DND-41 T-ALL (ALL) cells (one experiment with n = 8 replicates per treatment; the metabolites that significantly differed between sorted and pipetted AML cells and between sorted and pipetted ALL cells are shown in Figure 1—source data 3, Supplementary Table 2 and Figure 1—source data 4, Supplementary Table 3). Figure 1—source data 8 shows the raw metabolomics data for the comparison of AML to ALL cells. (I) Metabolites that significantly changed between AML and ALL cells in sorted versus pipetted samples (listed in Figure 1—source data 5, Supplementary Table 4). (J, K) Correlation between log2 fold changes (in AML versus ALL cells) in sorted versus pipetted samples for all detected metabolites (J) and metabolites that significantly differed between sorted AML and ALL cells (K). (L–P): (L) Number of metabolites above background in 10,000 pipetted WBM cell samples at various times after the death of the mouse (one experiment with n = 5 replicates per time point). (M) Number of metabolites that significantly increased or decreased at each time point relative to the 5 min time point (the metabolites are listed in Figure 1—source data 6, Supplementary Table 5). (N–P) Log2-transformed (N), non-transformed (O), and non-transformed intensity values for metabolites <1×10⁸ (P) in the 5 versus 120 min samples. The statistical significance of differences between treatments was assessed using a paired t-test (A), a Kolmogorov–Smirnov test (B) followed by Holm–Sidak’s multiple comparisons adjustment, repeated measures one-way ANOVA followed by Tukey’s (D) or Dunnett’s (G) multiple comparisons adjustment, repeated measures two-way ANOVA followed by Sidak’s multiple comparisons adjustment (F), or Spearman correlation analysis (J, K, N–P). All statistical tests were two-sided. Data represent mean ± SD. See also Figure 1—figure supplement 1.

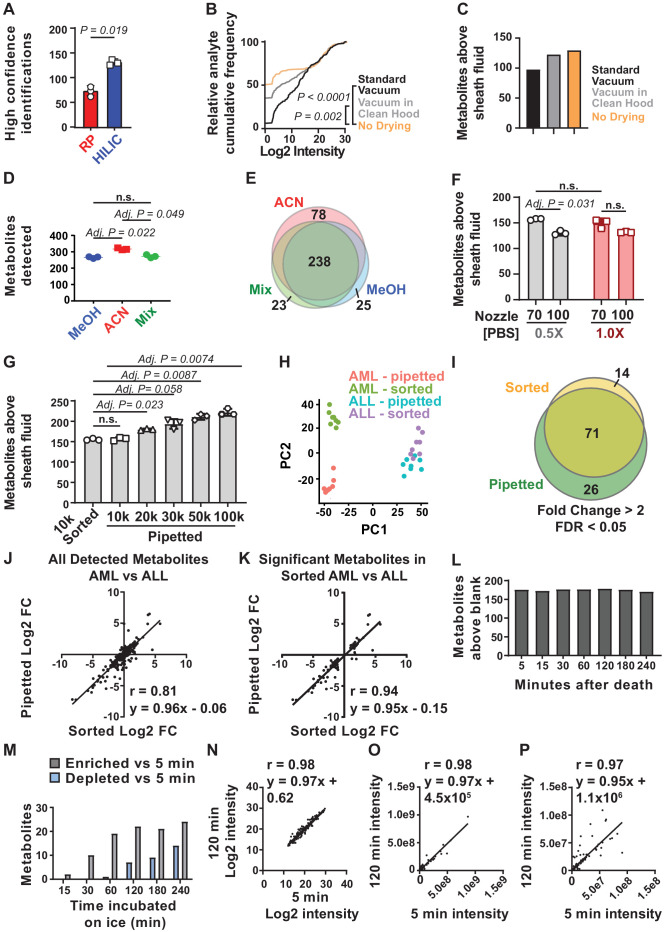
Figure 1—source data 1. All source data for Figure 1.
elife-61980-fig1-data1.xlsx (197.5KB, xlsx)
Figure 1—source data 2. Supplementary table 1A-B.
Metabolites enriched or depleted in cells sorted using 1× phosphate buffered saline (PBS) sheath fluid vs 0.5× PBS sheath fluid (fold change >2 and false discovery rate [FDR] < 0.05). Supplementary table 1b. Metabolites enriched or depleted in cells sorted using 1× PBS sheath fluid vs 0.5× PBS sheath fluid (fold change = 1.5–2 and FDR < 0.05). Correlation analysis of metabolite levels from 1× PBS versus 0.5× PBS samples: Spearman r = 0.995, y = 1.3 × −2142387. These metabolites were not significantly enriched in any metabolic pathway by pathway enrichment analysis.
Figure 1—source data 3. Supplementary table 2A-B.
Metabolites enriched or depleted in sorted vs pipetted AML cells (fold change >2 and false discovery rate [FDR] < 0.05). Correlation analysis of sorted versus pipetted AML samples: spearman r = 0.997, y = 1.1 × +214263. Metabolites that differed between sorted and pipetted AML cells were significantly enriched in ‘cysteine and methionine metabolism’. Supplementary table 2b. Metabolites enriched or depleted in sorted versus pipetted AML cells (fold change = 1.5–2 and FDR < 0.05).
Figure 1—source data 4. Supplementary table 3A-B.
Metabolites enriched or depleted in sorted vs pipetted ALL cells (fold change >2 and false discovery rate [FDR] < 0.05). Correlation analysis: Spearman r = 0.999, y = 1.1 × –436390. The metabolites were not significantly enriched in any metabolic pathway. Supplementary table 3b. Metabolites enriched or depleted in sorted versus pipetted ALL cells (fold change = 1.5–2 and FDR < 0.05).
Figure 1—source data 5. Supplementary table 4A-B.
Metabolites that significantly differed between AML and ALL cells in both sorted and pipetted samples, sorted samples only, or pipetted samples only. Metabolites that significantly differed between AML and ALL cells in both sorted and pipetted samples were significantly enriched in ‘glycerophospholipid metabolism’. No pathways were enriched among metabolites that differed in only sorted samples or only in pipetted samples. Supplementary table 4b. Metabolites that significantly differed between sorted AML and ALL cells or pipetted AML and ALL cells and for which fold change was between 1.5 and 2 in either the sorted or pipetted samples (FDR < 0.05).
Figure 1—source data 6. Supplementary table 5.
Metabolites enriched or depleted at various time points after the incubation of cell suspensions on ice. The fold change cutoff is indicated in the left column. All are false discovery rate (FDR) < 0.05. Correlation analysis: 5 min versus 15 min: Spearman r = 0.998; 5 min versus 30 min: Spearman r = 0.996; 5 min versus 60 min: Spearman r = 0.992.
Figure 1—source data 7. Supplementary table 6A-B.
Metabolites enriched or depleted in whole bone marrow (WBM) cells isolated from cells suspended in phosphate buffered saline (PBS) versus Hank's Buffered Salt Solution (HBSS) (fold change >2 and false discovery rate [FDR] > 0.05). Correlation analysis: Spearman r = 0.960, y = 0.92 × +1759331. These metabolites were not significantly enriched in any metabolic pathway. Supplementary table 6b. Metabolites enriched or depleted in WBM cells isolated from cells suspended in PBS versus HBSS (fold change = 1.5–2 and FDR < 0.05).
Figure 1—source data 8. The raw metabolomic analyses from experiments comparing AML and ALL cells (Figure 1H–K).
These files contain the raw counts for each metabolite in each sample and the statistical comparisons between samples for each metabolite.
elife-61980-fig1-data8.xlsx (720.5KB, xlsx)

Figure 1.

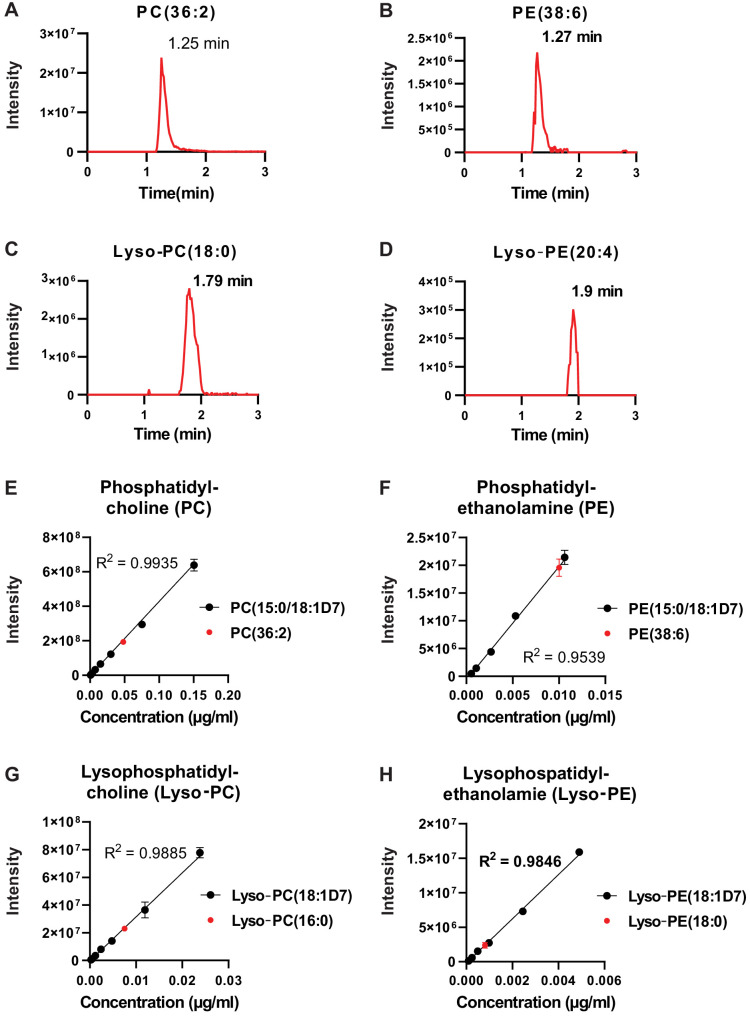
Figure 1—figure supplement 1. Chromatographic performance of lipids separated by HILIC.

Figure 1—figure supplement 1.

(A–D) Representative chromatograms for (A) phosphatidylcholine (PC [36:2]), (B) phosphatidylethanolamine (PE [38:6]), (C) lysophosphatidylcholine (Lyso-PC [18:0]), and (D) lysophosphatidylethanolamine (Lyso-PE [20:4]). (E–H) Standard curves of isotopically labeled lipids from four classes of lipids we detected (black) and the corresponding endogenous lipid (red) for (E) phosphatidylcholine, (F) phosphatidylethanolamine, (G) lysophosphatidylcholine, and (H) lysophosphatidylethanolamine (n = 3 replicates, data represent mean ± SD).
Figure 1—figure supplement 1—source data 1. Source data for Figure 1—figure supplement 1.