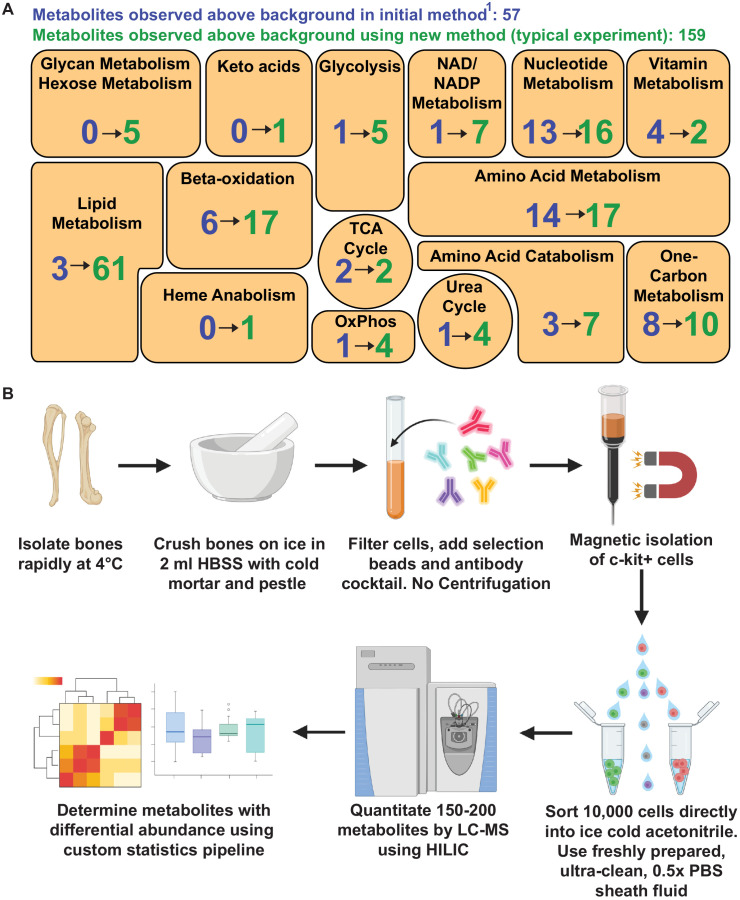
Figure 4. Metabolomic profiling of hematopoietic stem cells (HSCs) isolated by flow cytometry.
(A) Overview of the method. (B) Metabolites detected above background in 10,000 HSCs/multipotent progenitors (MPPs) in this study (green numbers, 159 metabolites total) as compared to our prior study using a different method (Agathocleous et al., 2017) (blue numbers, 57 metabolites total). These data are from one experiment, representative of four independent experiments. Metabolites detected above background were calculated by comparing three whole bone marrow (WBM) or three HSC/MPP samples to three sheath fluid blanks (fold change >2, false discovery rate [FDR] < 0.05).

