Figure 5. Dynamics of the pYpt7-bound HOPS complex on a lipid layer explored by single-molecule GIET.
(A, B) Representative time-lapse single-molecule intensity traces of Dy647NB-labeled HOPS Vps33-yEGFP (A) and HOPS Vps11-yEGFP (B) on glass (blue) and graphene (red). (C) Enlarged representation of the smGIET intensity fluctuations and fit by an HMM using a three-state segmentation. (D, E) Pooled single-molecule intensity distribution of Dy647NB-labeled HOPS Vps33-yEGFP (D, n = 101615) and HOPS Vps33-yEGFP (E, n = 84218) immobilized on graphene-supported monolayers via Ypt7-GTP. Intensities were classified by Gaussian fits as states of low (L, blue), medium (M, orange), and high (H, yellow), respectively. (F) Model schematically depicting possible conformational changes of HOPS in the L, M, and H state. State occupancies and distance changes of Vps11 and Vps33 are indicated. (G, H) Transition density plots of HOPS Vps33-yEGFP (G) and Vps11-yEGFP (H). The crosslines on M state are guide for the eye. (I) Conformational transition kinetics obtained from HMM. Diameters of the circles and sizes of the arrows are proportional to the averaged state occupancy and transition rates from results of HOPS Vps33 and Vps11, respectively.

Figure 5—figure supplement 1. Single-molecule detection of NB-labeled HOPS complexes bound to lipid-anchored pYpt7-GTP.

Figure 5—figure supplement 2. Pooled single-molecule intensity histograms for (A) HOPS Vps33-yEGFP (n = 60498) and (B) HOPS Vps11-yEGFP (n = 33317) on glass, respectively.

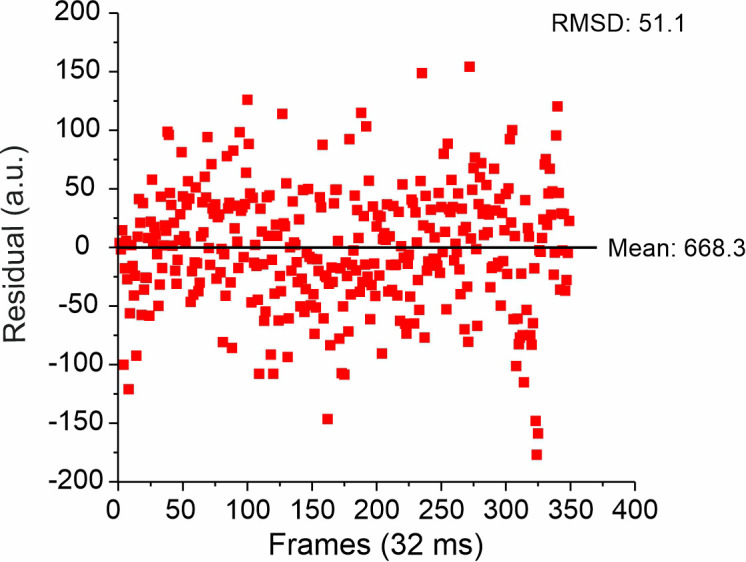
Figure 5—figure supplement 3. Representative root mean square deviation (RMSD) of single-molecule intensity traces on glass.