
Figure 3: Effect of a patient engagement programme on PAP use in the entire cohort (A) and age-based patient subgroups (B).
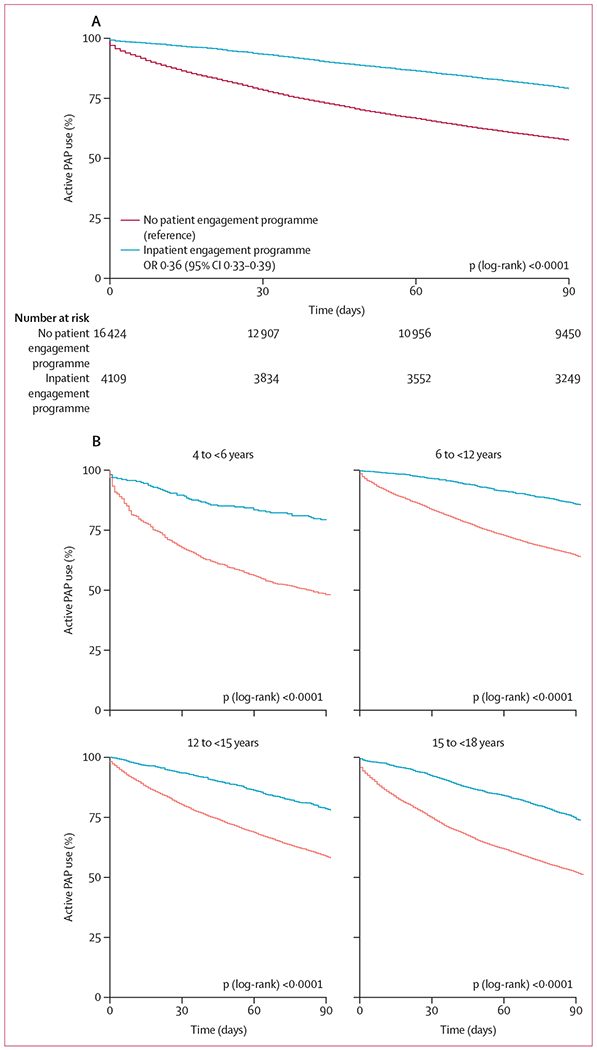
The number at risk reflects the number of remaining active PAP users at each time period. OR=odds ratio.
Official websites use .gov
A
.gov website belongs to an official
government organization in the United States.
Secure .gov websites use HTTPS
A lock (
) or https:// means you've safely
connected to the .gov website. Share sensitive
information only on official, secure websites.
The number at risk reflects the number of remaining active PAP users at each time period. OR=odds ratio.