Figure 3.

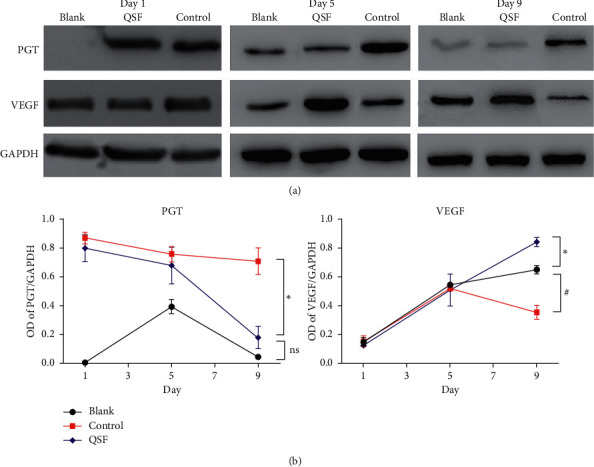
(a) Protein level of PGT and VEGF by western blot in the blank, control, and QSF groups of day1, day 5, and day 9. (b) OD of PGT/GAPDH and VEGF/GAPDH in the same groups. ∗P < 0.05, control vs. QSF. #P < 0.05 control vs blank.

(a) Protein level of PGT and VEGF by western blot in the blank, control, and QSF groups of day1, day 5, and day 9. (b) OD of PGT/GAPDH and VEGF/GAPDH in the same groups. ∗P < 0.05, control vs. QSF. #P < 0.05 control vs blank.