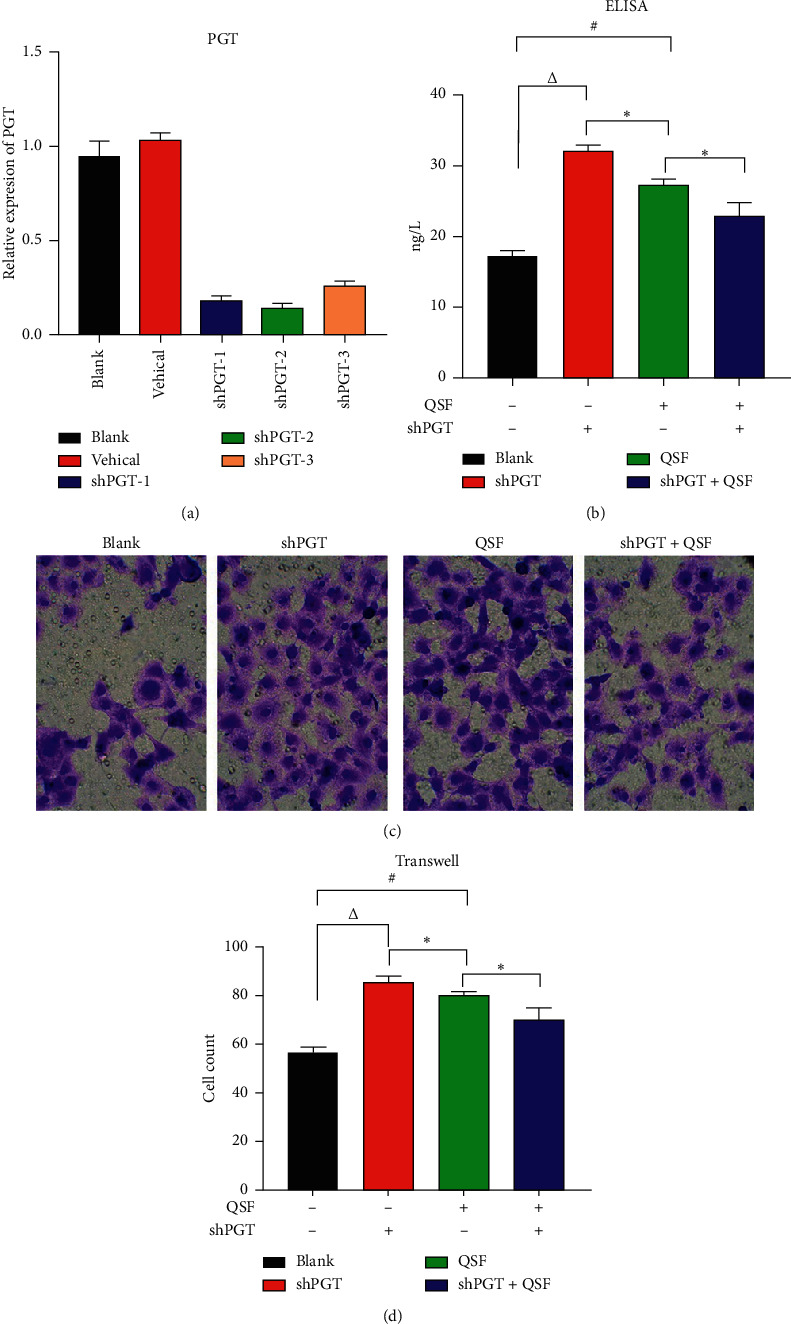
Figure 5.

(a) Relative expression of PGT in the blank, vehicle, shRNA-PGT-1, shRNA-PGT-2, and shRNA-PGT-3 groups. (b) The concentration of PGE2 in the blank, shRNA-PGT, QSF, and shRNA-PGT combined with QSF groups. ∗P < 0.05, QSF group vs shRNA + QSF and shRNA group; #P < 0.05, QSF vs blank; ΔP < 0.05, shPGT group vs blank group. (c) The pictures of Transwell in the same groups. (d) Cell count in the same groups. ∗P < 0.05, QSF group vs shRNA + QSF group; #P < 0.05, QSF vs blank; ΔP < 0.05, shPGT group vs blank group.
