
Figure 3.
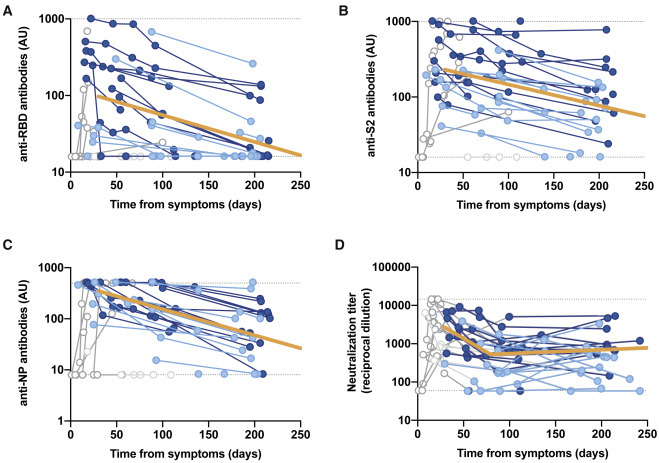
Longitudinal analysis of IgG titers
(A) Anti-receptor binding domain (RBD).
(B) Anti-S2.
(C) Anti-nucleoprotein.
(D) Overall neutralizing activity in the same set of samples. All of the analyses were performed on a subset of individuals with the largest follow-up (n = 14 for mild/asymptomatic in light blue and n = 14 for hospitalized in dark blue; total no. samples 94). Solid orange lines show the linear mixed model estimate for the period beyond day 30.
Kinetics of antibody decay (A–C) were calculated excluding time points preceding the maximal values for each patient. Kinetics of neutralizing antibodies excluded samples preceding day 30 (as in Figures 2A and 2B). All of the excluded values are shown but grayed out.