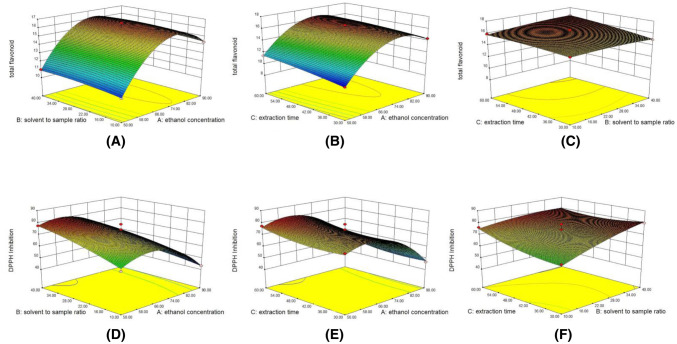
Fig. 3.
Response surface plots showing the effects of investigated variables on total flavonoids content and DPPH Inhibition: (A) effects of solvent to sample ratio and ethanol concentration on total flavonoid; (B) effects of extraction time and ethanol concentration on total flavonoid; (C) effects of extraction time and solvent to sample ratio on total flavonoid; (D) effects of solvent to sample ratio and ethanol concentration on DPPH Inhibition; (E) effects of extraction time and ethanol concentration on DPPH Inhibition; (F) effects of extraction time and solvent to sample ratio on DPPH Inhibition

