Fig. 2.
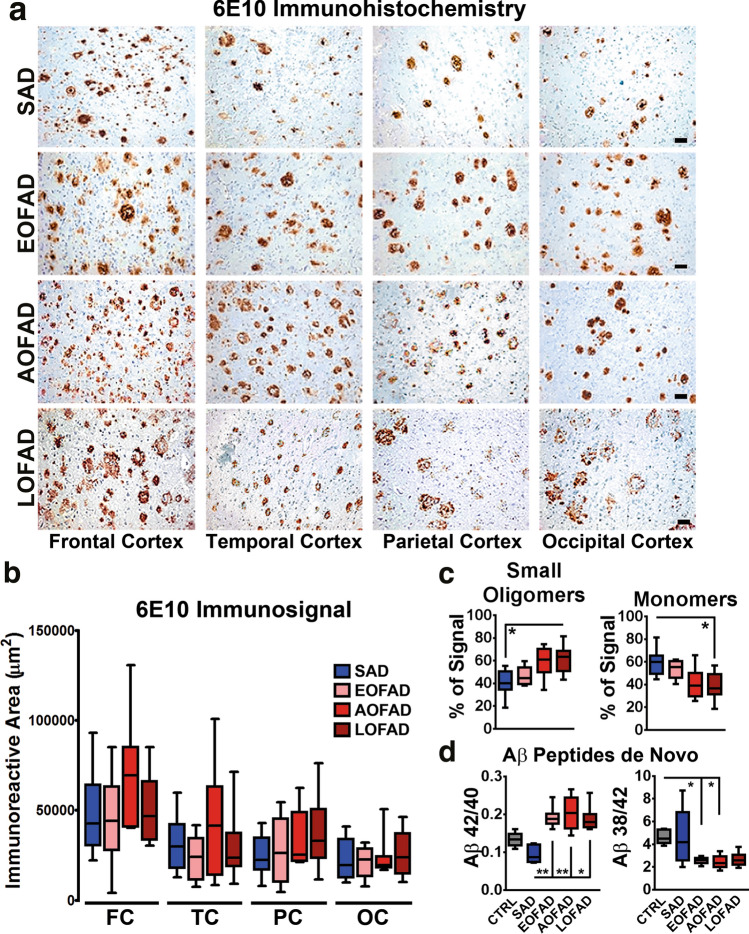
Distribution of Aβ pathology in brain regions of SAD and AoO groups of FAD PSEN1 E280A cases. a Immunohistochemical staining for Aβ using the 6E10 antibody in Frontal cortex, Temporal cortex, Parietal cortex, and Occipital cortex in SAD (n = 10), EOFAD (n = 8), AOFAD (n = 7), and LOFAD (n = 8). (Scale bar = 40 µm). b Quantification of Aβ plaque loads present in frontal cortex (FC), temporal cortex (TC), parietal cortex (PC), and occipital cortex (OC). There were not significant differences between groups. c Densitometric analysis boxplots for small Aβ oligomers and Aβ monomers. There were no significant differences between FAD groups. Only SAD cases presented significantly lower small oligomers and higher monomer levels when compared to LOFAD cases. d Boxplots of de novo generated Aβ peptide ratios in temporal cortex from Ctrl (n = 5), SAD (n = 5), EOFAD (n = 8), AOFAD (n = 7), and LOFAD (n = 8) cases. De novo generation of Aβ peptides was assessed by evaluating γ-secretase-dependent Aβ production in vitro using detergent-resistant membranes isolated from frontal cortex (see Supplementary Methods, online resource, for a detailed description). SAD Aβ1-42/1–40 ratios were significantly lower than EOFAD, AOFAD, and LOFAD; Ctrl Aβ1-38/1–42 ratios were significantly higher than EOFAD and AOFAD. (*= p ≤ 0.05, **= p ≤ 0.01)

