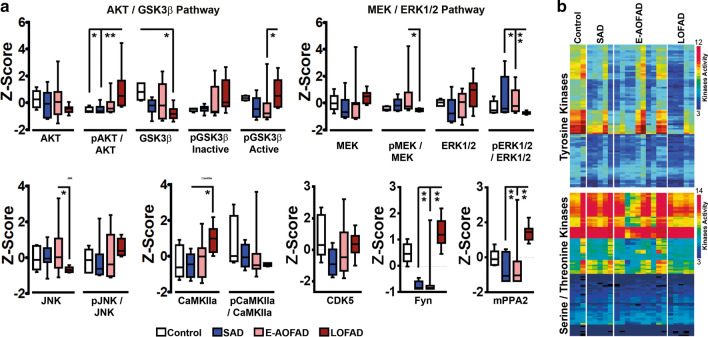
Fig. 4.
Tau kinase profile impact on AoO in PSEN1 E280A FAD. a Densitometric analysis in temporal cortex (TC) of basal and active forms of Tau kinases in controls (Control, n = 5), SAD (n = 10), E-AOFAD (n = 15), and LOFAD (n = 8). AKT/GSK3β pathway activation was significantly higher and MEK/ERK activation was lower in LOFAD when compared with E-AOFAD cases. Furthermore, JNK, Fyn, and mPPA2 steady-state levels were significantly different between LOFAD and E-AOFAD, while Fyn and mPPA2 levels were also significantly different between LOFAD and SAD cases (* = p ≤ 0.05, ** = p ≤ 0.01). b Logarithmic heatmap representation for significantly active or inactive kinases identified by microarray-based kinome profiling for Tyrosine (upper panel) and Serine/Threonine (lower panel) kinases in TC from Control (n = 3), SAD (n = 5), E-AOFAD (n = 10), and LOFAD (n = 5). LOFAD cases showed lower active Tyrosine kinases profile when compared with other groups. (FGFR4, RET, FGFR1, MERTK, EGFR, KIT, RYK, and other functionally related kinases; Supplementary Fig. 13A-B, online resource) and Serine/Threonine kinases (PDK1, MELK, MEK1, MEK2, MEK7, PKACb, PKCa, PKCb, PKCd, PKCe, PKCg, PKCt, HIPK2, HIPK3, HIPK4, AMPKa1, ANPa, and ZC2; Supplementary Fig. 14, online resource)

