Fig. 5.
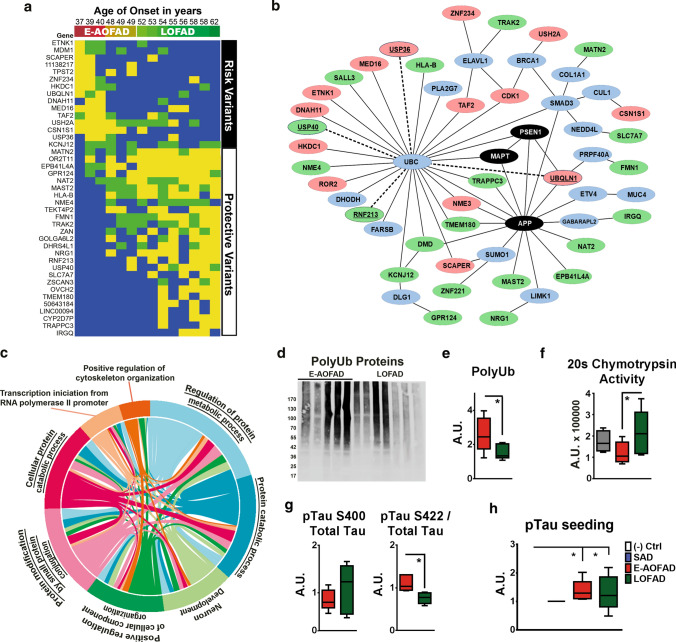
Association of ubiquitin and proteasome system function with pTau pathology and AoO in PSEN1 E280A FAD. a Schematic representation for AoO significantly associated variants in PSEN1 E280A FAD cases, early and average AoO FAD (E-AOFAD, n = 6), and LOFAD (n = 8), as characterized by whole-exome capture. Yellow = identified uncommon variants were present in both alleles, Gree n = identified uncommon variants were present in only one allele and, Blue = identified common variants were present in both alleles. b Protein network analysis of main AD-related genes and genes showing association with AoO in evaluated PSEN1 E280A FAD cases. Black ovals depict AD-related genes, pink circles early AoO-associated genes, and green circles late AoO-associated genes. Genes directly involved in the ubiquitin–proteasome system are underscored and connected with dotted lines. c Chord diagram of statistically significant biological pathways (GO:BP analysis) in which AoO-associated genes take part. Four pathways, underscored, are related with protein metabolism and catabolism. d Representative semi-denaturing immunoblot for polyubiquitinated proteins (PolyUb) in TBS-soluble fractions from temporal cortex of early and average AoO FAD. E. Densitometric analysis of PolyUb in TBS-soluble fractions from temporal cortex of E-AOFAD (n = 5) and LOFAD (n = 7). E-AOFAD cases showed significantly higher levels of PolyUb. F. Chymotrypsin S20 proteasome activity in temporal cortex tissue from controls (n = 4), E-AOFAD (n = 6), and LOFAD (n = 8) cases as detected by LLVY-AMC substrate. LOFAD cases showed significantly higher Chymotrypsine proteasome activity when compared to E-AOFAD cases. g Densitometric analysis of co-immunoprecipitation using monoclonal polyubiquitin antibody as bait and immunoblots for total Tau, pTau-S400, and pTau-S422 in TBS-soluble fractions from temporal cortex of E-AOFAD (n = 5) and LOFAD (n = 7). There were no significant differences between E-AOFAD and LOFAD cases for pTau-S400/total Tau ratio. However, E-AOFAD cases showed higher pTau-S422/total Tau ratio than LOFAD cases. h Bar graph representing pTau seeding capacity assays in temporal cortices homogenates from negative Controls (n = 2), SAD (n = 2), E-AOFAD (n = 5), and LOFAD (n = 5) cases. Both FAD groups showed increased pTau seeding activity when compared to negative controls. (* = p ≤ 0.05)

