Fig. 6.
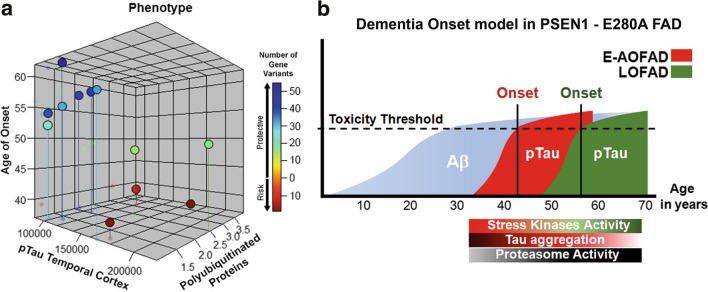
Phenotypic and dementia onset models in PSEN1-E280A FAD. a Three-dimensional plot of E-OFAD (n = 5) and LOFAD (n = 7) cases according to pTau levels in temporal cortex (Fig. 3), PolyUb and AoO. Colors from blue to red represent number of protective or risk genetic variants identified in these patients. LOFAD cases cluster together with lower pTau levels in temporal cortex, low polyubiquitinated protein levels, and higher number of protective gene variants. b Schematic model for the impact of Aβ aggregation, pTau aggregation, and ubiquitin/proteasome function in dementia onset in PSEN1 E280A FAD. All patients have in common Aβ progression rate. However, earlier disease onset is associated with earlier and more severe Tau pathology, stress kinases activation, and lower proteasome activity

