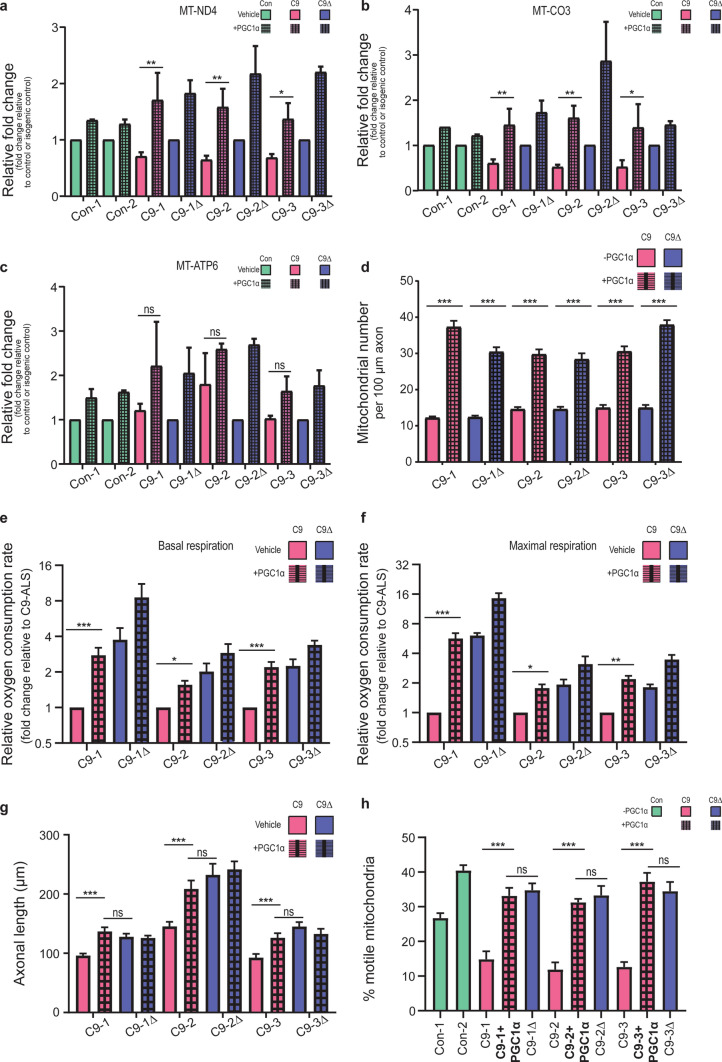
Fig. 5.
C9orf72-dependent dysfunctional axonal homeostasis is caused by mitochondrial bioenergetic dysfunction in human iPSC-derived MNs. a–c Mean fold change ± SEM of gene expression normalised to the respective isogenic control (or control) determined via RT-PCR; genotypes used: two independent controls [Con-1, Con-2], three independent patient-derived C9orf72 lines [C9-1, C9-2, C9-3; red bars] with their corresponding isogenic controls [C9-1Δ, C9-2Δ, C9-3Δ; blue bars], with (hatched bars) and without (unhatched bars) PGC1α overexpression, for transcripts: MT-ND4 (complex I; a), MT-CO3 (complex IV; b), and MT-ATP6 (complex V; c). d Quantification of the axonal mitochondrial number in a 100 µm stretch of distal axon in C9orf72-MNs and their respective isogenic controls, with (hatched bars) and without (unhatched bars) PGC1α overexpression. Data are represented as mean ± SEM; n ≥ 4 axons per line per experiment, with experiments repeated in three independent cultures from different differentiations (N = 3). Statistical significance was evaluated with one-way ANOVA with post hoc mutant-isogene paired FDR-corrected t tests. Quantification of the relative oxygen consumption rate (OCR) as measured by the Seahorse Analyzer, normalised to the amount of total protein, denoting basal (e) and maximal FCCP-uncoupled (f) mitochondrial respiration for C9orf72-MNs and isogenic paired controls, with (hatched bars) and without (unhatched bars) PGC1α overexpression. Data are represented as mean fold change (relative to C9orf72-ALS) ± SEM; n ≥ 4 wells per line per experiment, with experiments repeated in three independent cultures from different differentiations (N = 3). Statistical significance was evaluated with one-way ANOVA with post hoc mutant-isogene paired FDR-corrected t tests. g Quantification of the SMI-312 antibody-labelled axonal length in MNs 7 days post platedown, with (hatched bars) and without (unhatched bars) PGC1α overexpression (n > 15 axons per independent MN differentiation, N = 3 independent differentiations; data are represented as mean ± SEM; genotypes used: three independent patient-derived C9orf72 lines [C9-1, C9-2, C9-3] with their corresponding isogenic controls [C9-1Δ, C9-2Δ, C9-3Δ]; statistical significance was evaluated using the Kruskal–Wallis test with FDR correction). h Quantification of the percentage of motile mitochondria (labelled with mitoDsRed2) relative to the total number of mitochondria in a 100 µm stretch of axon in C9orf72-MNs, with (hatched bars) and without (unhatched bars) PGC1α overexpression, and isogenic paired controls; two independent healthy controls are also shown. Data are represented as mean ± S.E.M; n ≥ 4 axons per independent MN differentiation, N = 3 independent differentiations. Statistical significance was evaluated with the Kruskal–Wallis test with FDR correction. *p < 0.05, **p < 0.01, ***p < 0.001, ‘ns’ denotes non-significant result (p ≥ 0.05)

