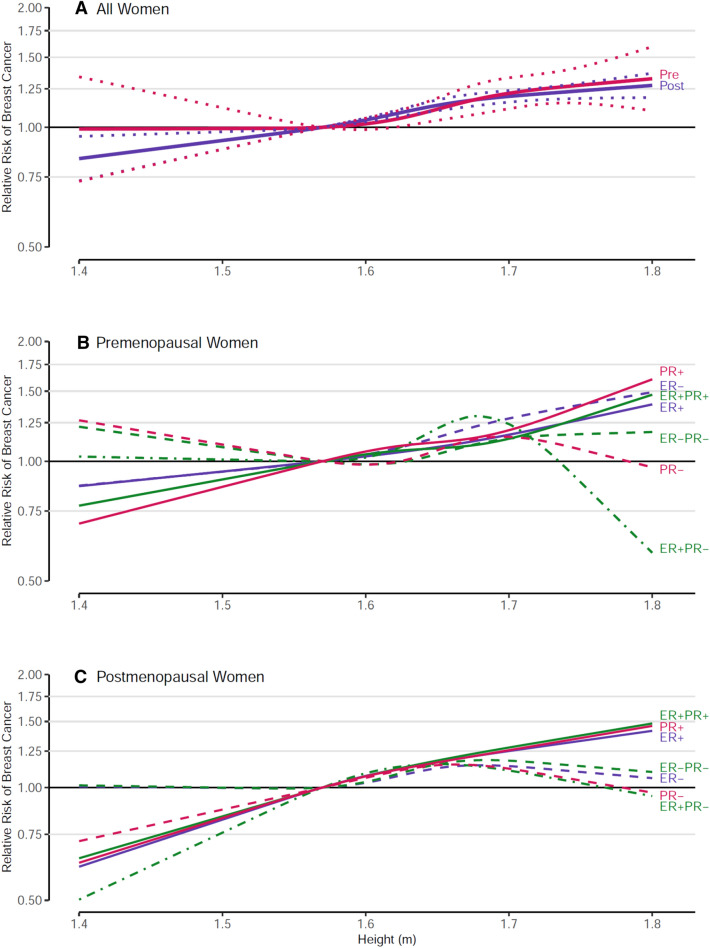
Fig. 1.
Spline regression curves for the association between height and breast cancer risk, the Pooling Project of Prospective Studies of Diet and Cancer, with reference height = 1.57 m. Panel A shows the associations for overall premenopausal breast cancer (pre (red); p value, test for nonlinearity = 0.363) and overall postmenopausal breast cancer (post (blue); p value, test for nonlinearity = 0.147). Solid lines represents point estimates and dotted lines represent 95% confidence intervals. Panel B shows the associations for premenopausal breast cancer subtypes defined by estrogen receptor (ER) and progesterone receptor (PR) status. The p value, test for nonlinearity = 0.846 for ER positive (ER+, blue solid line), 0.882 for ER negative (ER−, blue dashed line), 0.610 for PR+ (red solid line), 0.385 for PR− (red dashed line), 0.664 for ER+ PR+ (green solid line), 0.232 for ER+ PR− (green dash-dotted line), and 0.683 for ER− PR− breast cancer (green dashed line). Panel C shows the associations for postmenopausal breast cancer subtypes defined by ER and PR status. The p value, test for nonlinearity = 0.736 for ER+ (blue solid line), 0.247 for ER− (blue dashed line), 0.855 for PR+ (red solid line), 0.223 for PR− (red dashed line), 0.875 for ER+ PR+ (green solid line), 0.455 for ER+ PR− (green dash-dotted line), and 0.248 for ER− PR− breast cancer (green dashed line). Models were adjusted for ethnicity (Caucasian, African–American, Hispanic, Asian, others), family history of breast cancer (yes, no), personal history of benign breast disease (yes, no), alcohol consumption (non-drinkers, > 0–< 5, 5–< 15, 15–< 30, ≥ 30 g/day), smoking status (never, past, current), education (< high school, high school, > high school), physical activity (low, medium, high), age at menarche (< 11, 11–12, 13–14, ≥ 15 years), baseline BMI (< 23, 23–< 25, 25–< 30, ≥ 30 kg/m2), oral contraceptive use (never, ever), hormone replacement therapy (never, ever), energy intake (kcal/d, continuous), interaction between parity (0,1–2, ≥ 3) and age of first birth (< 30, ≥ 30 years); age at baseline in years and year of questionnaire return were included as stratification variables

