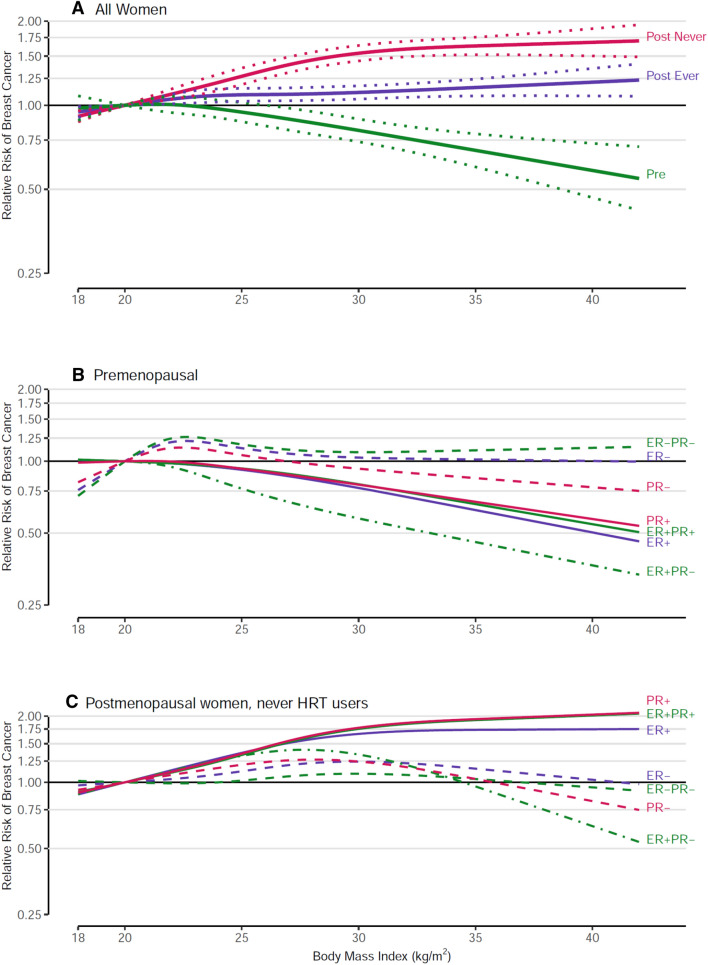
Fig. 2.
Spline regression curves for the association between body mass index at baseline and breast cancer risk, the Pooling Project of Prospective Studies of Diet and Cancer, with reference 20 kg/m2. Panel A shows the associations for overall premenopausal breast cancer (pre; p value, test for nonlinearity = 0.150), overall postmenopausal breast cancer among never users of hormone therapy (post never; p value, test for nonlinearity < 0.001), and overall postmenopausal breast cancer among ever users of hormone therapy (post ever; p value, test for nonlinearity = 0.208). Panel B shows the associations for premenopausal breast cancer subtypes defined by estrogen receptor (ER) and progesterone receptor (PR) status. The p value, test for nonlinearity = 0.371 for ER+, 0.043 for ER−, 0.484 for PR+, 0.111 for PR−, 0.512 for ER+ PR+, 0.911 for ER+ PR−, and 0.084 for ER− PR− breast cancer. Panel C shows the associations for postmenopausal breast cancer subtypes defined by ER and PR status among never users of hormone therapy. The p value, test for nonlinearity = < 0.001 for ER+, 0.138 for ER−, < 0.001 for PR+, < 0.001 for PR−, < 0.001 for ER+ PR+, < 0.001 for ER+ PR−, and 0.558 for ER− PR− breast cancer. Models were adjusted for ethnicity (Caucasian, African–American, Hispanic, Asian, others), family history of breast cancer (yes, no), personal history of benign breast disease (yes, no), alcohol consumption (non-drinkers, > 0–< 5, 5–< 15, 15–< 30, ≥ 30 g/day), smoking status (never, past, current), education (< high school, high school, > high school), physical activity (low, medium, high), age at menarche (< 11, 11–12, 13–14, ≥ 15 years), height (< 1.60, 1.60–< 1.65, 1.65–< 1.70, 1.70–< 1.75, ≥ 1.75 m), oral contraceptive use (never, ever), energy intake (kcal/d, continuous), interaction between parity (0, 1–2, ≥ 3) and age of first birth (< 30, ≥ 30 years); age at baseline in years and year of questionnaire return were included as stratification variables

