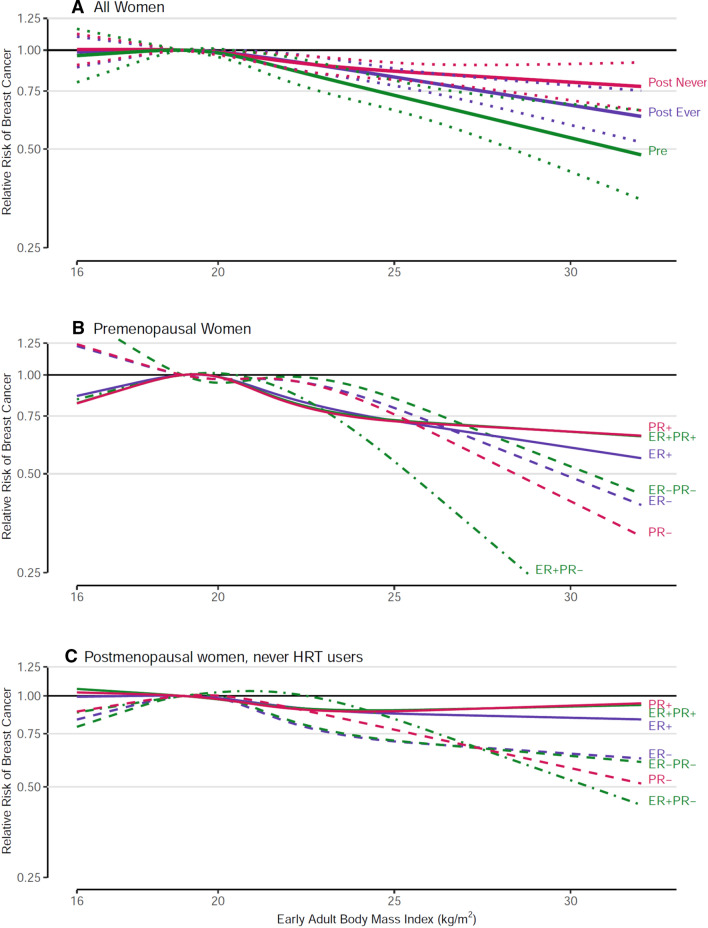
Fig. 3.
Spline regression curves for the association between early adulthood body mass index and breast cancer risk, the Pooling Project of Prospective Studies of Diet and Cancer, with reference 19 kg/m2. Panel A shows the associations for overall premenopausal breast cancer (pre; p value, test for nonlinearity = 0.088), overall postmenopausal breast cancer among never users of hormone therapy (post never; p value, test for nonlinearity = 0.509), and overall postmenopausal breast cancer among ever users of hormone therapy (post ever; p value, test for nonlinearity = 0.068). Panel B shows the associations for premenopausal breast cancer subtypes defined by estrogen receptor (ER) and progesterone receptor (PR) status. The p value, test for nonlinearity = 0.090 for ER+, 0.469 for ER−, 0.047 for PR+, 0.271 for PR−, 0.074 for ER+ PR+, 0.178 for ER+ PR−, and 0.347 for ER−PR− breast cancer. Panel C shows the associations for postmenopausal breast cancer subtypes defined by ER and PR status among never users of hormone therapy. The p value, test for nonlinearity = 0.544 for ER+, 0.130 for ER−, 0.305 for PR+, 0.074 for PR−, 0.390 for ER+ PR+, 0.060 for ER+ PR−, and 0.116 for ER−PR− breast cancer. Models were adjusted for the same factors as in Fig. 2

