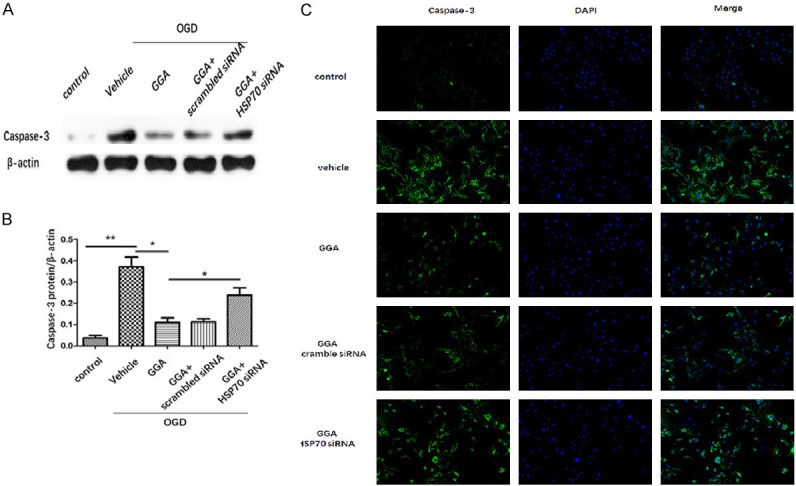
Figure 8.

HSP70 suppression abrogated GGA’s effect on caspase-3. A, B. Representative protein bands and quantified evaluation of cleavedcaspase-3 (mean ± SEM, n=3). C. Representative microphotographs of immunofluorescence staining of caspase-3. Caspase-3 (green) and the nuclei (DAPI, blue). *P<0.05 compared with indicated group; **P<0.01 versus indicated group.
