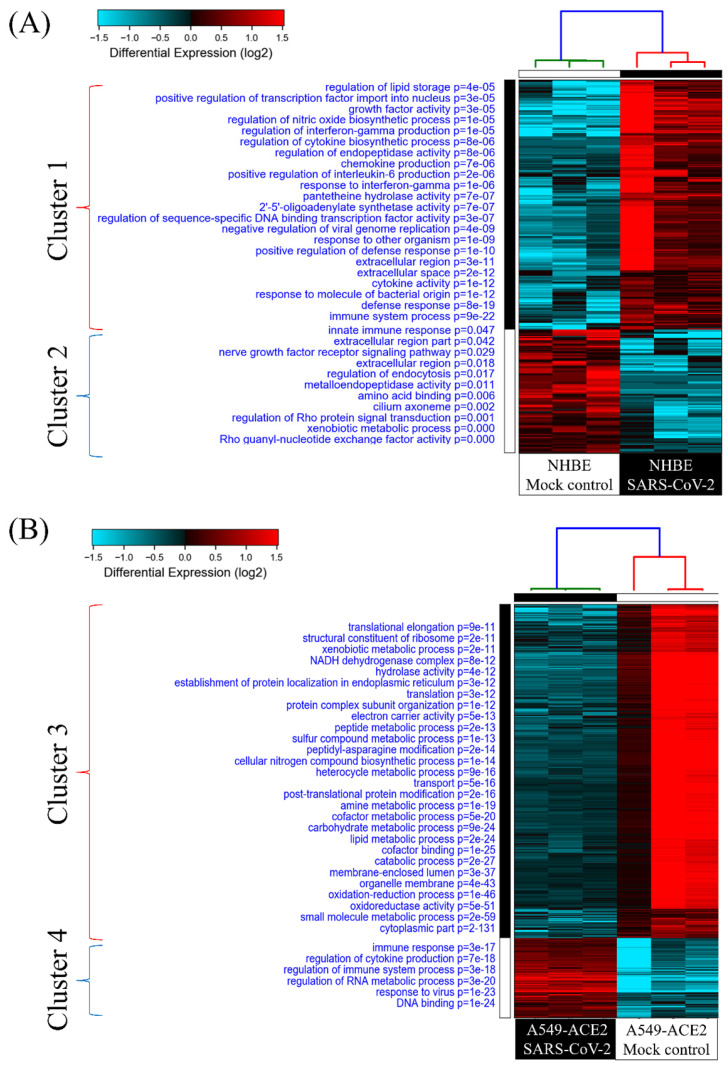
Figure 2.
Heatmap visualization of enriched gene ontology (GO) from severe acute respiratory syndrome coronavirus (SARS-CoV)-2-infected lung epithelial cells compared to mock-infected control group. (A) Comparison between SARS-CoV-2-infected and mock-infected normal human bronchial epithelial (NHBE) cells. Upregulated genes were analyzed by a GO enrichment analysis for associated pathways. Cluster 1 pathways were derived from upregulated genes in SARS-CoV-2-infected cells, and cluster 2 pathways were of downregulated genes. (B) Comparison between SARS-CoV-2-infected and mock-infected A549 cells transduced with a vector expressing human ACE2. Upregulated genes were analyzed by a GO enrichment analysis for associated pathways. Cluster 3 pathways were derived from downregulated genes in SARS-CoV-2-infected cells and cluster 4 from upregulated genes.

