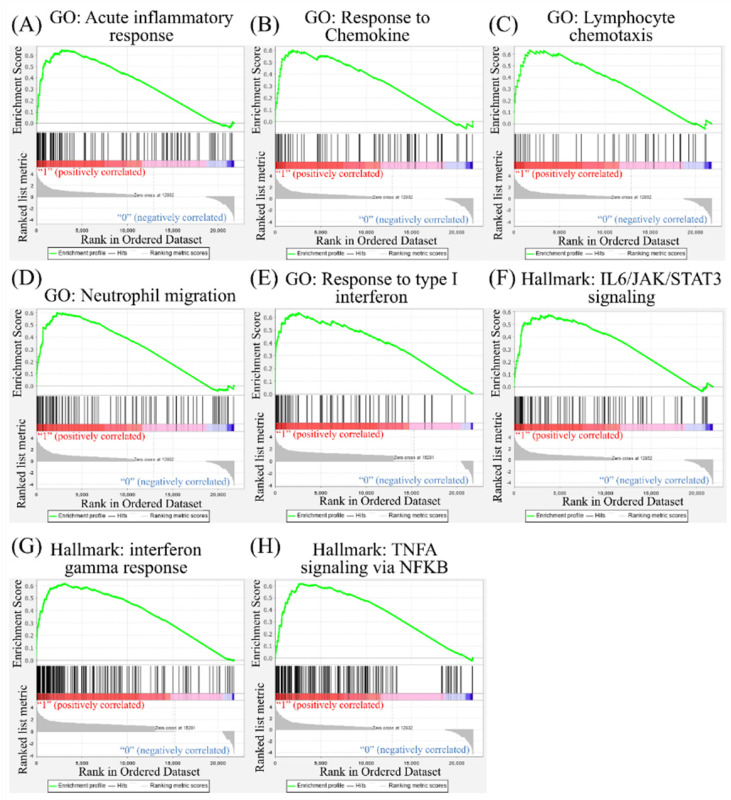
Figure 4.
Gene Set Enrichment Analysis (GSEA) showing enriched immune-related pathways in severe acute respiratory syndrome coronavirus (SARS-CoV)-2 infected cells. The Gene Ontology (GO) and Hallmark platforms were used to analyze upregulated genes from SARS-CoV-2-infected ACE2-expressed-A549 and normal human bronchial epithelial (NHBE) cells relative to mock-infected controls. An enrichment score threshold of >0 was set for upregulation. In the middle portion of each figure, members of each gene set are represented as a single bar. For positive correlations highlighted in red, bars shown before the peak score contributed the most to that score, whereas for negative correlations highlighted in blue, bars shown right after the peak score contributed the most to that score. In the last portion of each graph, the ranking metric shows the correlation of the gene set with either the first or second phenotype. (A) Acute inflammatory response. (B) Response to chemokines. (C) Lymphocyte chemotaxis. (D) Neutrophil migration. (E) Response to type I interferon. (F) Interleukin (IL)-6/Janus kinase (JAK)/signal transducer and activator of transcription 3 (STAT3) signaling. (G) Interferon-gamma response. (H) Tumor necrosis factor-α (TNFA) signaling via nuclear factor-κB (NFKB).

