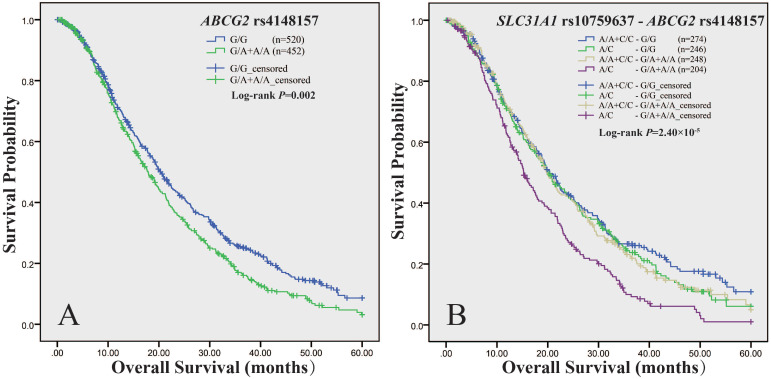
Figure 1.
Kaplan-Meier curve of estimated overall survival for the NSCLC cohort according to ABCG2 and SLC31A1 polymorphisms. The curves were plotted with SPSS software according to the genotypes of ABCG2 rs4148157 (A), and the combined genotypes of ABCG2 rs4148157 and SLC31A1 rs10759637 (B). For ABCG2 rs4148157 G/A, the G/A+A/A genotypes group was compared to the wild G/G as reference in dominant model. For SLC31A1rs10759637 A/C, which had been genotyped in our previous report (Ref 9), the A/C heterozygote was compared to the A/A+C/C homozygotes group as reference in under-dominant model.

