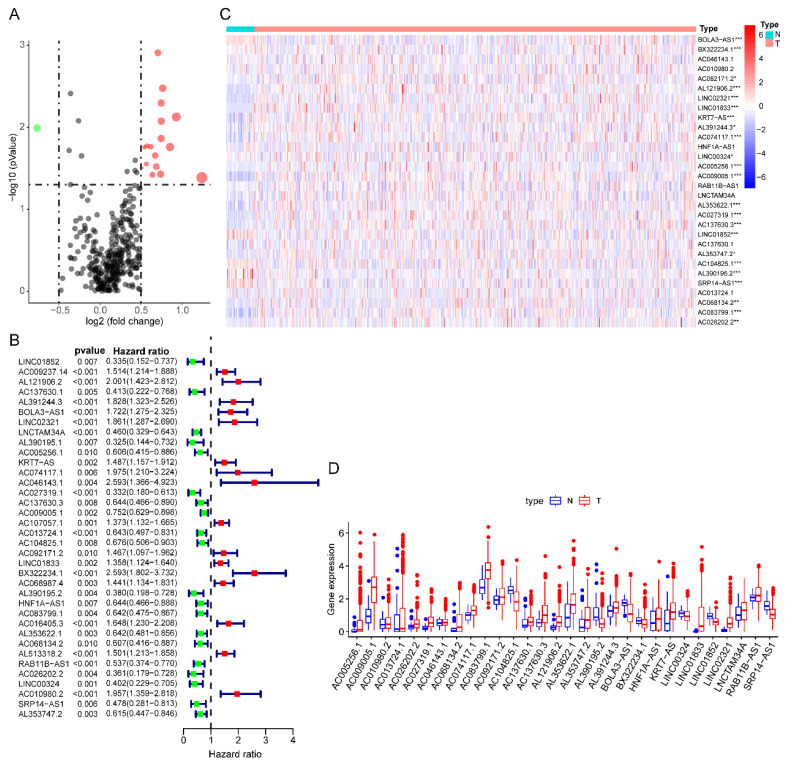
Figure 2.
The expression profiles of prognostic glycolysis-related lncRNA between TCGA endometrial cancer (EC) and normal tissues. (A) Volcano plot of glycolysis-related lncRNA in EC and normal samples of the TCGA dataset. The horizontal axis indicates the log2 (fold change [FC]) and the vertical axis indicates the -log(P-value). Red dots and the green dots represent over- and down-expressed lncRNAs, respectively (P-value<0.05 and |log2(FC)|>1). (B) Univariate Cox regression identified 36 lncRNAs correlated to EC patients' outcomes. (C) Heat map of the 36 lncRNAs in the entire CGA EC cohort. Red and blue indicate higher expression and lower expression, respectively. * represents <0.05, ** represent <0.01, ***represent <0.001. (D) Box plot of the expression of the lncRNAs between cancerous and normal tissues. Red and blue boxes indicate cancerous and normal tissue, respectively.

