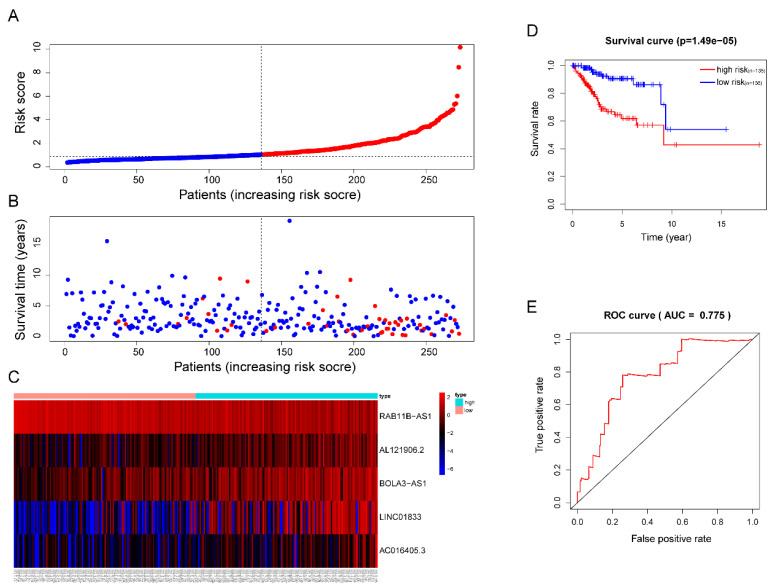
Figure 5.
Prognostic analysis of the lncRNA signature in the TCGA training cohort. (A)The risk score, (B) survival status, (C) expression heatmap, (D) Kaplan-Meier survival, and (E) time-dependent ROC curves of the prognostic model for the TCGA EC training cohort. In part (A) and (B), red and blue represent dead and alive, respectively; In part (C), red and blue indicate higher expression and lower expression, respectively.

