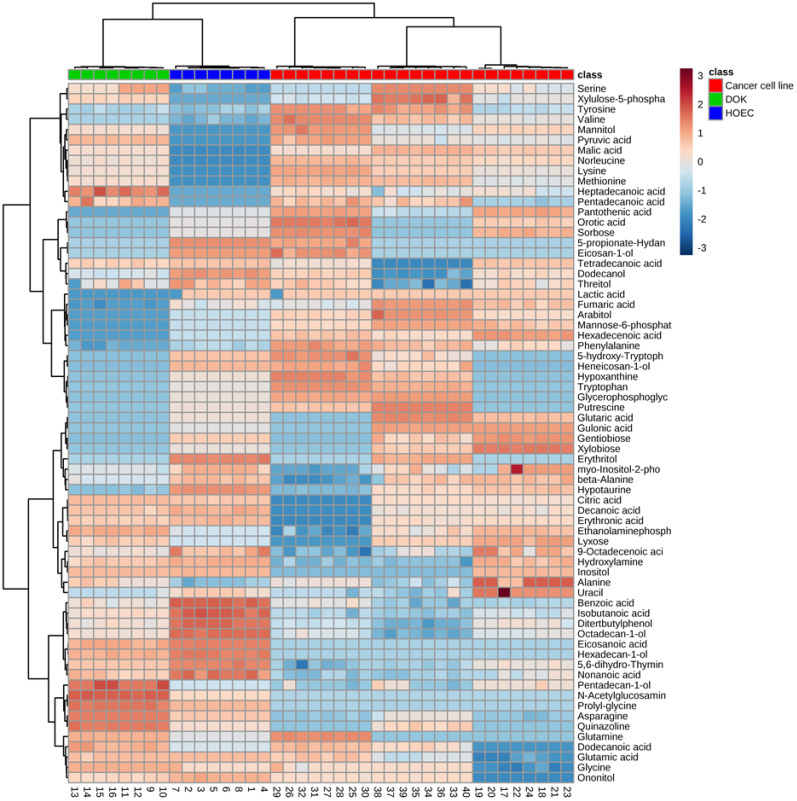
Figure 2.
Differential metabolomics profiles of normal human oral epithelial cells (HOEC), dysplastic oral keratinocyte (DOK) and oral cancer cell lines SCC090, SCC9 and Tca8113. The heatmap shows 73 differential metabolites. Wine red and pewter indicate increased and decreased metabolites relative to the median metabolite levels, respectively (see color scale).

