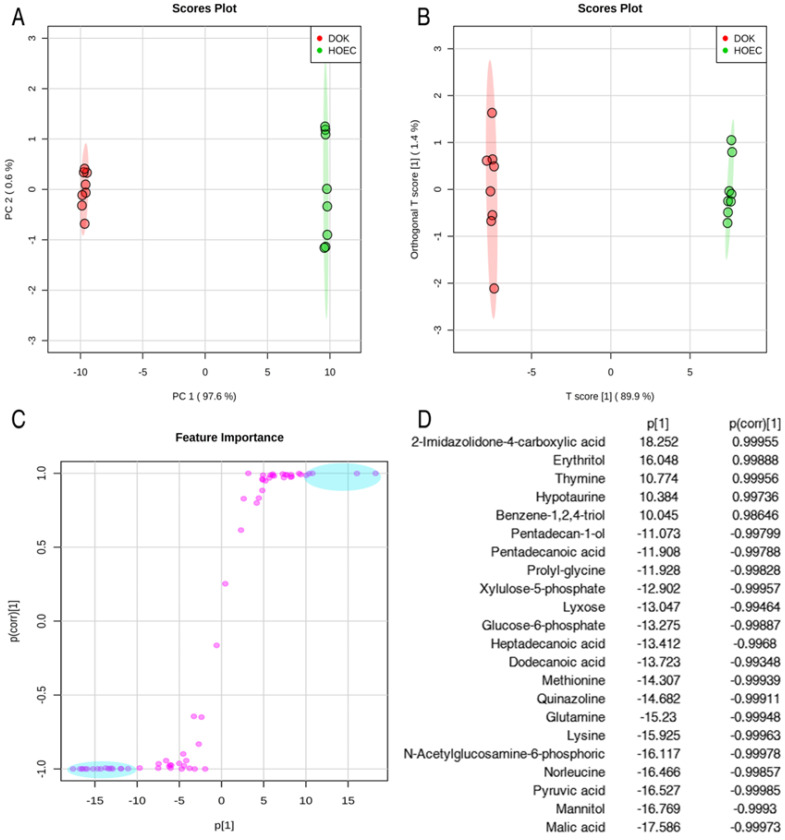
Figure 3.
Identification of metabolomic candidates. PCA analysis of metabolites of HOEC and DOK cells (A). Each dot represents the technological replicate analysis of samples in the plot. PC1 and PC2 used in this plot explain 98.2% of the total variance, which allows for confident interpretation of the variation. Orthogonal partial least squares discriminant analysis (OPLS-DA, R2X=0.899, R2Y=0.999, Q2=0.999) (B). Score plot drawn with OPLS-DA (C). The crucial metabolomic candidates, shown in the light blue oval box (C), were selected by the weight absolute values of p1 and p(corr)1, which are more than 10 and 0.9, respectively (D).

