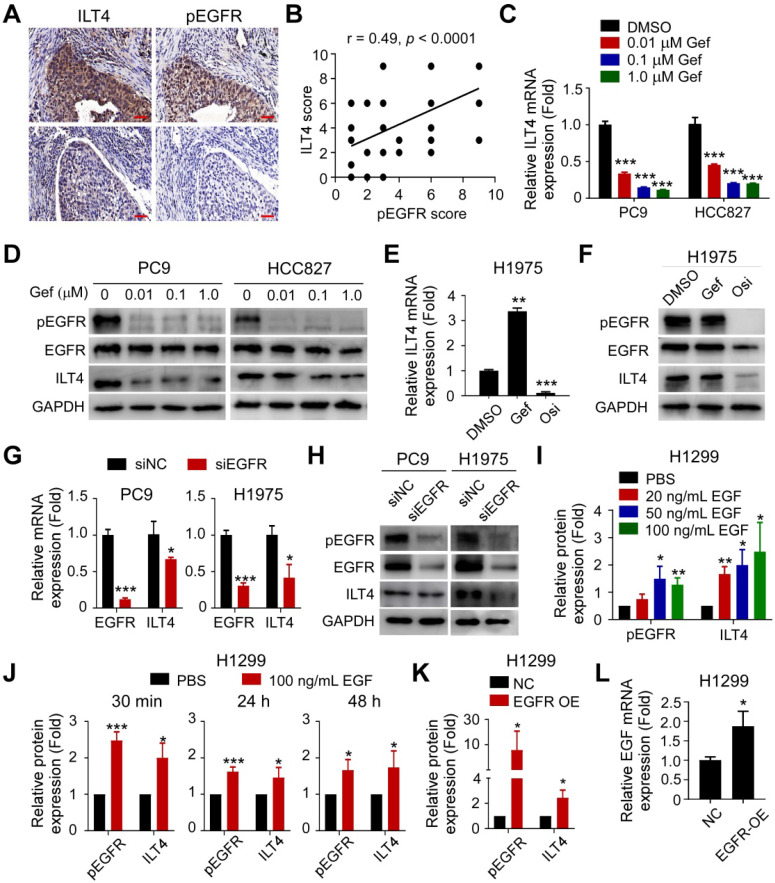
Figure 1.
ILT4 expression in NSCLC cells was induced by EGFR activation. (A-B) ILT4 expression in tumor cells of NSCLC tissues was positively correlated with pEGFR levels by IHC analysis. Tumor samples were sequentially sectioned and stained with ILT4 and pEGFR primary antibodies (A) Representative images of ILT4 and pEGFR co-localization, brown granules define positive staining. (B) Statistical results from 80 patients. Scale bar: 20 µm. (C-D) Inhibition of EGFR activation using gefitinib significantly decreased mRNA (C) and protein (D) expression of ILT4 in a concentration-dependent manner in PC9 and HCC827 cells harboring activating EGFR mutation. PC9 and HCC827 cells were treated with a gradient concentration of gefitinib for 24 h before real-time PCR and Western blot analyses. (E-F) Inhibition of EGFR activation using osimertinib but not gefitinib markedly reduced mRNA (E) and protein (F) expression of ILT4 in EGFR T790M-mutant H1975 cells. The cells were treated with osimertinib (0.1 µM) or gefitinib (0.1 µM) for 24 h, and mRNA and protein expression of ILT4 were analyzed by real-time PCR and Western blotting. (G-H) Knockdown of EGFR in PC9 and H1975 cells decreased ILT4 mRNA (G) and protein (H) levels. PC9 and H1975 cells were transfected with specific EGFR siRNA, and the mRNA or protein expression of ILT4 and EGFR was analyzed 72 h after transfection using real-time PCR and Western blotting. (I-J) EGF stimulation of EGFR wild-type H1299 cells elevated ILT4 expression in both concentration- (I) and time-dependent (J) manners. (I-J) Average results from 3 independent experiments. H1299 cells were treated with different concentrations of EGF for 24 h or with 100 ng/mL EGF for different durations and Western blotting was performed to determine ILT4, EGFR, and pEGFR levels. (K-L) Overexpression of EGFR in H1299 cells increased pEGFR, ILT4 (L) and EGF (K) levels determined by Western blotting or real-time PCR. ILT4 and pEGFR expression were detected 48 h after transfection of EGFR overexpression plasmid using Western blotting, while EGF level was detected by real-time PCR. *, p < 0.05; **, p < 0.01; ***, p < 0.001. Gef: gefitinib; NC: normal control; OE: overexpression plasmid; Osi: osimertinib; si: small interfering RNA.

